Standard Deviation And Coefficient Of Variation
News Leon
Mar 25, 2025 · 6 min read
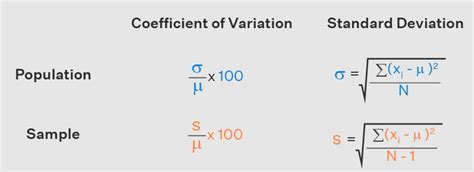
Table of Contents
Understanding Standard Deviation and Coefficient of Variation: A Deep Dive
Standard deviation and coefficient of variation are fundamental statistical concepts used to describe the dispersion or spread of a dataset. While both quantify variability, they do so in different ways, making them suitable for different applications. This comprehensive guide will delve into the intricacies of each, explaining their calculations, interpretations, and practical applications. We’ll also explore when to use one over the other and how to interpret the results in various contexts.
What is Standard Deviation?
Standard deviation measures the average distance of individual data points from the mean (average) of the dataset. A higher standard deviation indicates greater variability, meaning the data points are more spread out, while a lower standard deviation suggests that the data points are clustered closely around the mean. Think of it as a measure of how much the individual data points deviate from the average.
Calculating Standard Deviation:
The calculation of standard deviation involves several steps:
-
Calculate the mean (average): Sum all the data points and divide by the number of data points.
-
Calculate the deviations: Subtract the mean from each data point.
-
Square the deviations: Square each of the deviations calculated in step 2. This eliminates negative values and emphasizes larger deviations.
-
Calculate the variance: Sum the squared deviations and divide by the number of data points minus one (for sample standard deviation) or by the number of data points (for population standard deviation). Dividing by n-1 (sample) provides an unbiased estimate of the population variance.
-
Calculate the standard deviation: Take the square root of the variance. This returns the standard deviation to the original units of the data.
Formula for Sample Standard Deviation:
σ = √[ Σ(xi - x̄)² / (n - 1) ]
Where:
- σ = sample standard deviation
- xi = individual data point
- x̄ = sample mean
- n = sample size
- Σ = summation
Formula for Population Standard Deviation:
σ = √[ Σ(xi - μ)² / N ]
Where:
- σ = population standard deviation
- xi = individual data point
- μ = population mean
- N = population size
- Σ = summation
Interpreting Standard Deviation:
A high standard deviation signifies that the data points are widely scattered around the mean, suggesting significant variability within the dataset. Conversely, a low standard deviation indicates that the data points are clustered tightly around the mean, indicating low variability. The interpretation is always relative to the context of the data and the units being measured. A standard deviation of 10 might be large for one dataset but small for another.
Applications of Standard Deviation:
Standard deviation finds extensive use across various fields:
- Finance: Assessing the risk associated with investments. A high standard deviation of returns indicates a higher risk.
- Manufacturing: Monitoring the consistency of a production process. A low standard deviation indicates higher process control.
- Healthcare: Evaluating the effectiveness of a treatment. A low standard deviation in patient outcomes suggests a more consistent and predictable treatment effect.
- Research: Analyzing the variability in experimental results. A low standard deviation increases the reliability of the study's findings.
- Quality Control: Identifying outliers and variations in production runs to ensure quality.
What is Coefficient of Variation (CV)?
The coefficient of variation (CV) is a normalized measure of dispersion. Unlike standard deviation, which is expressed in the same units as the data, the CV is a unitless measure expressed as a percentage. It represents the ratio of the standard deviation to the mean, providing a relative measure of variability. This makes it particularly useful for comparing the variability of datasets with different units or scales.
Calculating Coefficient of Variation:
The calculation of the CV is straightforward:
CV = (Standard Deviation / Mean) * 100%
Interpreting Coefficient of Variation:
The CV provides a standardized way to compare variability across different datasets, even if they have different units or scales. A higher CV indicates greater relative variability, while a lower CV suggests lower relative variability. For example, a CV of 10% indicates that the standard deviation is 10% of the mean, while a CV of 50% suggests a much higher degree of relative variability.
Applications of Coefficient of Variation:
The CV is particularly valuable when:
- Comparing datasets with different units or scales: The CV allows for a meaningful comparison of variability even when datasets use different measurement units.
- Identifying datasets with high variability: A high CV highlights datasets where data points are significantly dispersed relative to their mean, suggesting potentially important sources of variability or heterogeneity.
- Assessing data quality: High CV values may flag issues with the data quality, accuracy, or inconsistencies in measurement methods.
Standard Deviation vs. Coefficient of Variation: When to Use Which?
The choice between standard deviation and coefficient of variation depends on the specific research question and the nature of the data:
| Feature | Standard Deviation | Coefficient of Variation |
|---|---|---|
| Units | Same units as the data | Unitless (percentage) |
| Interpretation | Absolute measure of dispersion | Relative measure of dispersion |
| Comparison | Difficult to compare across datasets with different units | Easy to compare across datasets with different units |
| Use Case | When the absolute dispersion is of primary interest | When comparing variability across datasets with different scales or units |
Examples Illustrating the Differences:
Scenario 1: Comparing the variability of heights (in cm) and weights (in kg) of a group of people. The standard deviation of heights and weights would be in different units (cm and kg), making direct comparison impossible. However, using the coefficient of variation allows for a direct comparison of the relative variability of heights and weights.
Scenario 2: Analyzing the variability of stock prices over a period of time. While the standard deviation provides the absolute variability in price, the coefficient of variation allows for comparison of the relative variability of several different stocks with different average prices. A stock with a high CV might signify higher risk.
Scenario 3: Assessing the precision of a measuring instrument. Here, the standard deviation of repeated measurements reveals the absolute level of scatter, and a smaller standard deviation means higher precision.
Advanced Considerations and Applications
While we’ve covered the basics of standard deviation and coefficient of variation, several advanced considerations enhance their practical utility:
- Data Distribution: The standard deviation assumes a roughly normal or symmetrical distribution. In highly skewed distributions, alternative measures of dispersion, such as the interquartile range (IQR), might be more appropriate.
- Outliers: Outliers can significantly influence the standard deviation. Robust statistics, less sensitive to outliers, may be considered when dealing with data containing extreme values.
- Sample Size: The accuracy of the standard deviation estimate improves with increasing sample size. Smaller sample sizes can lead to less reliable estimates of population parameters.
Conclusion:
Standard deviation and coefficient of variation are powerful tools for quantifying and interpreting data variability. Understanding their differences and applications is crucial for accurate data analysis and informed decision-making across various fields. By carefully considering the nature of your data and your research question, you can choose the appropriate measure and derive meaningful insights from your data. Remember to always consider the context, and don’t hesitate to delve into more advanced statistical concepts for complex data sets or research questions.
Latest Posts
Latest Posts
-
What Percent Of 12 5 Is 39
Mar 28, 2025
-
In The Figure A Plastic Rod Having A Uniformly
Mar 28, 2025
-
Which Is Not True About The Genetic Code
Mar 28, 2025
-
In An Atom The Nucleus Contains
Mar 28, 2025
-
What Does Chr Do In Python
Mar 28, 2025
Related Post
Thank you for visiting our website which covers about Standard Deviation And Coefficient Of Variation . We hope the information provided has been useful to you. Feel free to contact us if you have any questions or need further assistance. See you next time and don't miss to bookmark.
