Why Is The Demand Curve Downward Sloping
News Leon
Mar 14, 2025 · 6 min read
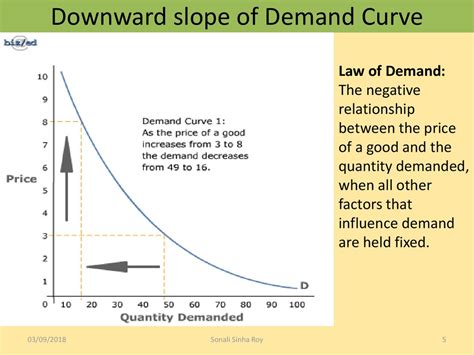
Table of Contents
Why is the Demand Curve Downward Sloping? A Comprehensive Analysis
The downward-sloping demand curve is a fundamental concept in economics, representing the inverse relationship between the price of a good or service and the quantity demanded. Understanding why this relationship exists is crucial for anyone seeking to grasp the intricacies of market dynamics, consumer behavior, and economic policy. This article will delve deep into the various factors contributing to this ubiquitous downward slope, exploring both the theoretical underpinnings and practical implications.
The Law of Demand: A Cornerstone of Economics
The downward-sloping demand curve is a direct manifestation of the Law of Demand, which states that, ceteris paribus (all other things being equal), as the price of a good decreases, the quantity demanded of that good increases, and vice versa. This seemingly simple statement encapsulates a complex interplay of economic forces, which we will explore in detail.
1. The Substitution Effect: Switching to Cheaper Alternatives
As the price of a good falls, it becomes relatively cheaper compared to its substitutes. This is the substitution effect. Consumers, being rational actors seeking to maximize their utility (satisfaction), will naturally substitute the now-cheaper good for its more expensive alternatives. For example, if the price of beef falls, consumers might substitute beef for chicken or pork, increasing their consumption of beef. This shift in consumption patterns contributes to the increased quantity demanded at the lower price.
2. The Income Effect: Increased Purchasing Power
A decrease in the price of a good effectively increases the consumer's purchasing power. This is the income effect. With the same amount of income, consumers can now afford to buy more of the good, not only because it's relatively cheaper but also because their overall budget allows for increased consumption. This increased purchasing power contributes to the higher quantity demanded at lower prices. This effect is particularly pronounced for normal goods, where demand increases with rising income. For inferior goods, the income effect might work in the opposite direction.
3. Diminishing Marginal Utility: The Law of Diminishing Returns in Consumption
The Law of Diminishing Marginal Utility suggests that as a consumer consumes more units of a good, the additional satisfaction (utility) derived from each additional unit decreases. This means the first unit consumed provides the most satisfaction, the second slightly less, and so on. Consumers are willing to pay a higher price for the first unit, reflecting its higher marginal utility. As more units are consumed, the willingness to pay decreases, reflecting the diminishing marginal utility. Consequently, to induce consumers to buy more, the price must fall.
Beyond the Basics: Nuances and Exceptions
While the downward-sloping demand curve is a generally accepted principle, several factors can complicate this relationship, leading to exceptions and nuances.
1. Giffen Goods: A Rare Exception
Giffen goods are a peculiar exception to the law of demand. These are inferior goods for which the income effect outweighs the substitution effect. This means that as the price of a Giffen good falls, the increase in purchasing power leads to a decrease in quantity demanded. The reason for this is that the good represents a significant portion of the consumer's budget. A fall in price frees up resources, allowing the consumer to afford more superior goods, leading to a reduction in demand for the Giffen good. These goods are relatively rare, often found in developing economies and typically involve essential staples like rice or potatoes.
2. Veblen Goods: The Conspicuous Consumption Paradox
Veblen goods are luxury goods whose demand increases as the price increases. This phenomenon is rooted in the concept of conspicuous consumption, where the high price itself becomes a desirable attribute, signaling status and exclusivity. The demand for such goods is driven by prestige and social signaling rather than purely utilitarian considerations. Examples include luxury cars, designer clothing, and exclusive jewelry. The upward-sloping demand curve for these goods contrasts sharply with the typical downward-sloping curve.
3. The Role of Expectations: Future Price Changes
Consumer expectations about future price changes can significantly impact current demand. If consumers anticipate a future price increase, they might increase their current demand, leading to a shift in the demand curve to the right. Conversely, if they expect a future price decrease, they might postpone their purchases, resulting in a leftward shift. This highlights the dynamic nature of demand and its sensitivity to future market conditions.
Graphical Representation and Shifting the Demand Curve
The downward-sloping demand curve is typically depicted as a smooth, negatively sloped line on a graph, with price on the vertical axis and quantity demanded on the horizontal axis. It's important to understand the difference between a movement along the demand curve and a shift in the demand curve.
-
Movement along the demand curve: This occurs when the price of the good changes, causing a change in the quantity demanded. This is illustrated by a movement along the existing demand curve.
-
Shift in the demand curve: This happens when factors other than the price of the good affect demand. These factors include changes in consumer income, consumer tastes and preferences, prices of related goods (substitutes and complements), consumer expectations, and the number of buyers in the market. A shift to the right indicates an increase in demand, while a shift to the left indicates a decrease.
Practical Implications: Understanding Market Dynamics
Understanding the downward-sloping demand curve has significant practical implications for businesses, policymakers, and consumers alike.
1. Pricing Strategies: Finding the Optimal Price Point
Businesses use their understanding of the demand curve to determine the optimal price point that maximizes their profits. This involves analyzing the price elasticity of demand (the responsiveness of quantity demanded to a change in price) to identify the price range that generates the most revenue.
2. Government Policies: Impact on Demand
Government policies like taxes and subsidies can influence the demand curve. Taxes increase the price, reducing quantity demanded, while subsidies decrease the price, increasing quantity demanded. Understanding these impacts is crucial for effective policy design.
3. Market Equilibrium: Where Supply Meets Demand
The interaction between the downward-sloping demand curve and the upward-sloping supply curve determines the market equilibrium – the point where the quantity demanded equals the quantity supplied. At this equilibrium point, the market clears, and there is no excess supply or demand.
Conclusion: A Dynamic and Essential Concept
The downward-sloping demand curve is not merely an abstract economic concept; it is a powerful tool for understanding the forces shaping market dynamics. While the Law of Demand provides a foundational understanding, the nuances of substitution effects, income effects, diminishing marginal utility, and the existence of exceptional cases like Giffen and Veblen goods showcase the complexity and dynamism inherent in consumer behavior. By grasping these intricacies, we can better analyze market trends, predict consumer responses to price changes, and ultimately develop more effective economic policies and business strategies. The downward-sloping demand curve, therefore, remains an indispensable concept for navigating the intricacies of the modern economy.
Latest Posts
Latest Posts
-
Coordination Number Of Body Centered Cubic
Mar 14, 2025
-
Integral Of 1 X 2 3
Mar 14, 2025
-
How Many Cubic Centimeters In 1 Cubic Meter
Mar 14, 2025
-
How Many Valence Electrons Does Kr Have
Mar 14, 2025
-
A Flywheel With A Diameter Of 1 20m Is Rotating
Mar 14, 2025
Related Post
Thank you for visiting our website which covers about Why Is The Demand Curve Downward Sloping . We hope the information provided has been useful to you. Feel free to contact us if you have any questions or need further assistance. See you next time and don't miss to bookmark.
