Which Of The Following Graphs Shows A Function
News Leon
Apr 07, 2025 · 6 min read
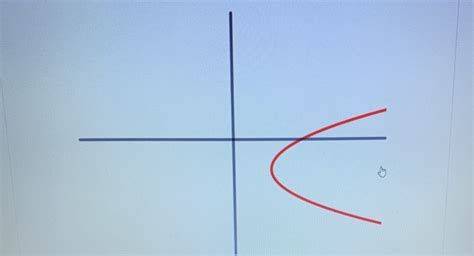
Table of Contents
Which of the Following Graphs Shows a Function? Understanding the Vertical Line Test
Determining whether a graph represents a function is a fundamental concept in algebra and precalculus. Understanding functions is crucial for progressing to more advanced mathematical concepts like calculus and differential equations. This article will delve deep into the definition of a function, explore various graphical representations, and provide a thorough explanation of the vertical line test, a simple yet powerful tool for identifying functions from their graphs. We will also look at some common pitfalls and misconceptions surrounding function identification.
What is a Function?
Before we examine graphs, let's solidify our understanding of what constitutes a function. A function is a relationship between a set of inputs (called the domain) and a set of possible outputs (called the range) with the property that each input is related to exactly one output. This "exactly one output" rule is the key characteristic that distinguishes a function from a mere relation. A relation is simply a connection between two sets, but a function imposes the restriction of a unique output for each input.
Think of a function like a machine. You put an input into the machine (the domain), and the machine processes it and produces exactly one output (the range). If you put the same input in twice, you get the same output twice. This predictability is a defining feature of functions.
The Vertical Line Test: The Visual Gateway to Identifying Functions
The vertical line test is a graphical method used to determine if a given graph represents a function. It's incredibly straightforward:
If any vertical line intersects the graph at more than one point, the graph does not represent a function. If every vertical line intersects the graph at most once, then the graph represents a function.
Let's break this down:
-
More than one intersection: This indicates that a single input (the x-coordinate where the vertical line intersects the x-axis) corresponds to multiple outputs (the y-coordinates of the intersection points). This violates the definition of a function, as each input must have only one output.
-
One or zero intersections: This means that each input value has at most one corresponding output value. This satisfies the definition of a function. A vertical line intersecting at zero points simply means that that particular input is not in the domain of the function.
Examples: Applying the Vertical Line Test
Let's consider several examples to illustrate the application of the vertical line test:
Example 1: A Straight Line (y = mx + c)
A straight line (excluding vertical lines) always represents a function. No matter where you draw a vertical line, it will intersect the line at most once. This is because each x-value has a unique y-value determined by the equation of the line.
Example 2: A Parabola (y = x²)
A parabola, such as y = x², also represents a function. Again, any vertical line will intersect the parabola at most once. Each x-value has only one corresponding y-value.
Example 3: A Circle (x² + y² = r²)
A circle, represented by the equation x² + y² = r², does not represent a function. If you draw a vertical line through the circle, it will intersect the circle at two points (except for the lines that intersect at the extreme left and right points). This indicates that for a given x-value, there are two corresponding y-values, violating the function definition.
Example 4: An Ellipse (x²/a² + y²/b² = 1)
Similar to a circle, an ellipse also fails the vertical line test and therefore does not represent a function. Many vertical lines will intersect the ellipse at two points.
Example 5: A Hyperbola (x²/a² - y²/b² = 1 or y²/a² - x²/b² = 1)
Depending on the orientation, a hyperbola may or may not be a function. A hyperbola of the form x²/a² - y²/b² = 1 is not a function, while a hyperbola of the form y²/a² - x²/b² = 1 is a function. This illustrates the importance of carefully examining the equation and graph.
Common Mistakes and Misconceptions
Several common mistakes can occur when applying the vertical line test:
-
Misinterpreting the test: Some students mistakenly think that the vertical line must intersect every point on the graph. This is incorrect; the crucial point is whether any vertical line intersects the graph at more than one point.
-
Focusing only on "nice" lines: Students sometimes only check vertical lines that pass through easily identifiable points. Remember to consider all possible vertical lines, including those that intersect the graph at less visually obvious points.
-
Confusing relations with functions: Remember that a relation is simply a pairing of inputs and outputs. A function is a specific type of relation where each input has exactly one output. The vertical line test helps distinguish between these two.
Beyond the Vertical Line Test: Other Representations of Functions
While the vertical line test is particularly useful for graphical representations, functions can also be represented in other ways:
-
Algebraically: An equation like y = 2x + 1 explicitly defines a function. For every input x, there is a unique output y.
-
Set Notation: Functions can be defined using sets of ordered pairs, such as {(1, 2), (2, 4), (3, 6)}. Here, each input (first element of the pair) has only one output (second element of the pair).
-
Mapping Diagrams: A mapping diagram visually shows the input-output pairings. If an input has multiple arrows pointing to different outputs, it's not a function.
Advanced Considerations: Piecewise Functions and Implicit Functions
The concept of functions extends beyond simple equations. Let's consider two more complex cases:
Piecewise Functions
Piecewise functions are defined by different formulas over different intervals of the domain. The vertical line test still applies; you need to consider the entire graph, including all pieces. If any vertical line intersects the graph more than once across all pieces, it's not a function.
Implicit Functions
Implicit functions are defined by equations where x and y are not explicitly separated. For example, x² + y² = 25 defines a circle (not a function). Even though the equation doesn't explicitly solve for y, the vertical line test still effectively determines if the graph represents a function.
Conclusion: Mastering Function Identification
Understanding functions is critical for success in mathematics. The vertical line test offers a simple yet powerful visual method to determine whether a graph represents a function. Remember that a function requires each input to have exactly one output. By carefully applying the vertical line test and understanding the key concepts, you can confidently identify functions from their graphical representations and progress confidently through more advanced mathematical studies. Mastering the vertical line test is not just about passing tests; it's about developing a deep understanding of the fundamental building blocks of mathematics. This understanding will serve as a solid foundation for more complex concepts you will encounter in your mathematical journey.
Latest Posts
Latest Posts
-
How Many Symmetry Lines Does A Square Have
Apr 08, 2025
-
What Two Factors Affect Kinetic Energy
Apr 08, 2025
-
5 Letter Word With 3 Vowels And 2 Consonants
Apr 08, 2025
-
Is H2 O2 H2o A Redox Reaction
Apr 08, 2025
-
Which Of The Following Can Serve As A Nucleophile
Apr 08, 2025
Related Post
Thank you for visiting our website which covers about Which Of The Following Graphs Shows A Function . We hope the information provided has been useful to you. Feel free to contact us if you have any questions or need further assistance. See you next time and don't miss to bookmark.