How To Find Variance Of Probability Distribution
News Leon
Mar 16, 2025 · 6 min read
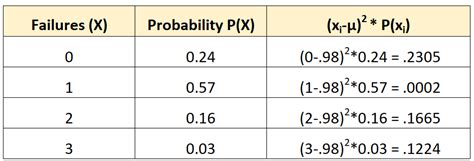
Table of Contents
How to Find the Variance of a Probability Distribution
Understanding variance is crucial in statistics and probability. It measures how spread out a probability distribution is. A high variance indicates data points are far from the mean, while a low variance suggests they cluster closely around the mean. This article will comprehensively guide you through calculating the variance of various probability distributions, from discrete to continuous, and highlight practical applications.
Understanding Variance and its Importance
Before diving into calculations, let's solidify the concept of variance. Variance (σ²) is the average of the squared differences from the mean. This means we're essentially calculating how far each data point deviates from the average, squaring those deviations (to eliminate negative values canceling out positive ones), and then averaging those squared deviations. The square root of the variance is the standard deviation (σ), which is often preferred because it's in the same units as the original data, making it more interpretable.
Why is variance important?
- Risk Assessment: In finance, variance is crucial for assessing the risk associated with investments. A higher variance implies higher risk because returns are more volatile.
- Quality Control: In manufacturing, variance helps determine the consistency of a product. Low variance indicates high precision and consistent quality.
- Predictive Modeling: In machine learning, variance is a key metric in model evaluation. High variance suggests overfitting, meaning the model is too closely tied to the training data and may not generalize well to new data.
- Statistical Inference: Variance plays a fundamental role in hypothesis testing and confidence intervals. It helps determine the reliability of statistical conclusions.
Calculating Variance for Discrete Probability Distributions
For discrete probability distributions, where the variable can only take on specific values, the variance calculation is straightforward. The formula is:
σ² = Σ [(xᵢ - μ)² * P(xᵢ)]
Where:
- σ² is the variance.
- xᵢ represents each value the random variable can take.
- μ is the mean (expected value) of the distribution.
- P(xᵢ) is the probability of the random variable taking the value xᵢ.
- Σ denotes the summation over all possible values of xᵢ.
Step-by-Step Guide:
-
Calculate the mean (μ): This is done by summing the product of each value and its probability: μ = Σ [xᵢ * P(xᵢ)]
-
Calculate the squared deviations: For each value xᵢ, compute (xᵢ - μ)².
-
Weight the squared deviations: Multiply each squared deviation by its corresponding probability P(xᵢ).
-
Sum the weighted squared deviations: Add up all the results from step 3. This sum is the variance.
Example:
Let's consider a simple discrete distribution:
| xᵢ | P(xᵢ) |
|---|---|
| 1 | 0.2 |
| 2 | 0.3 |
| 3 | 0.5 |
-
Calculate the mean: μ = (1 * 0.2) + (2 * 0.3) + (3 * 0.5) = 2.3
-
Calculate squared deviations:
- (1 - 2.3)² = 1.69
- (2 - 2.3)² = 0.09
- (3 - 2.3)² = 0.49
-
Weight the squared deviations:
- 1.69 * 0.2 = 0.338
- 0.09 * 0.3 = 0.027
- 0.49 * 0.5 = 0.245
-
Sum the weighted squared deviations: Variance (σ²) = 0.338 + 0.027 + 0.245 = 0.61
Calculating Variance for Continuous Probability Distributions
For continuous probability distributions, where the variable can take on any value within a given range, the variance calculation involves integration. The formula is:
σ² = ∫ [(x - μ)² * f(x)] dx
Where:
- σ² is the variance.
- x is the random variable.
- μ is the mean (expected value) of the distribution. This is calculated as μ = ∫ [x * f(x)] dx
- f(x) is the probability density function (PDF) of the distribution.
- ∫ denotes integration over the entire range of x.
This integration can be challenging for many distributions, and often requires specialized knowledge of calculus and integral techniques. Fortunately, many standard continuous distributions have known variance formulas.
Variance of Common Probability Distributions
Here's a table summarizing the variance for some frequently encountered distributions:
| Distribution | Variance (σ²) |
|---|---|
| Bernoulli | p(1-p) |
| Binomial | np(1-p) |
| Poisson | λ |
| Uniform (a, b) | (b-a)²/12 |
| Normal (μ, σ) | σ² (Note: σ is the standard deviation, and σ² is the variance) |
| Exponential (λ) | 1/λ² |
Understanding the Parameters:
- p: Probability of success in a Bernoulli or Binomial trial.
- n: Number of trials in a Binomial distribution.
- λ: Rate parameter in Poisson and Exponential distributions.
- a, b: Lower and upper bounds of a Uniform distribution.
- μ, σ: Mean and standard deviation of a Normal distribution.
These formulas significantly simplify the variance calculation for these common distributions, eliminating the need for tedious calculations from first principles.
Practical Applications and Examples
Let's explore some real-world applications to illustrate the importance and practical use of variance calculations:
1. Investment Portfolio Management:
Imagine an investor considering two stocks. Stock A has a mean return of 10% with a variance of 25, while Stock B has a mean return of 12% with a variance of 100. Although Stock B offers a higher average return, its significantly higher variance indicates much greater risk. The investor needs to carefully weigh the higher expected return against the increased volatility.
2. Quality Control in Manufacturing:
A factory produces bolts with a target diameter of 10mm. Using variance calculations, the quality control team can assess the consistency of the production process. A low variance indicates the bolts are consistently close to the target diameter, minimizing defects. A high variance signifies inconsistency, requiring adjustments to the manufacturing process.
3. Predictive Modeling in Machine Learning:
A machine learning model is trained to predict house prices. After training, the model's variance is assessed. High variance indicates overfitting, meaning the model is too complex and memorizes the training data instead of learning general patterns. This results in poor performance on new, unseen data. Techniques like regularization are used to reduce variance and improve the model's generalization ability.
Advanced Topics and Considerations
-
Sample Variance vs. Population Variance: The formulas presented above calculate the population variance. When dealing with a sample of data instead of the entire population, a slightly different formula is used, involving dividing by (n-1) instead of n (where n is the sample size). This correction accounts for the fact that sample means tend to underestimate the true population mean.
-
Covariance and Correlation: For multiple variables, covariance measures how they change together. Correlation is a standardized measure of covariance, ranging from -1 to +1. Understanding covariance and correlation is important when dealing with multivariate data and assessing the relationships between variables.
-
Higher-Order Moments: Variance is the second central moment of a distribution. Higher-order moments, such as skewness and kurtosis, provide additional information about the shape of the distribution. Skewness measures the asymmetry, while kurtosis measures the "tailedness."
-
Statistical Software: Statistical software packages like R, Python (with libraries like NumPy and SciPy), and MATLAB provide functions to efficiently compute the variance of various probability distributions. These tools significantly reduce the computational burden, especially for complex distributions.
Conclusion
Understanding and calculating the variance of a probability distribution is a fundamental skill in statistics and probability. It provides crucial insights into data variability, risk assessment, quality control, and predictive modeling. This article has covered calculating the variance for both discrete and continuous distributions, explored the variance of common distributions, and highlighted practical applications. While the mathematical concepts can be challenging, mastering these techniques opens the door to a deeper understanding of data analysis and statistical inference. Remember that statistical software can simplify computations, especially for complex distributions. Focusing on understanding the core concepts and their practical applications will allow you to effectively utilize variance in various fields.
Latest Posts
Latest Posts
-
A Charge Of Uniform Linear Density
Mar 17, 2025
-
Which Of The Following Is Polynomial
Mar 17, 2025
-
Is Boiling Water A Physical Change
Mar 17, 2025
-
Is A Webcam An Input Or Output Device
Mar 17, 2025
-
Word For A Person Who Uses Big Words
Mar 17, 2025
Related Post
Thank you for visiting our website which covers about How To Find Variance Of Probability Distribution . We hope the information provided has been useful to you. Feel free to contact us if you have any questions or need further assistance. See you next time and don't miss to bookmark.
