How To Calculate Average Velocity On A Velocity Time Graph
News Leon
Mar 21, 2025 · 5 min read
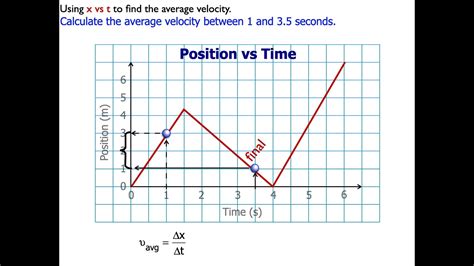
Table of Contents
How to Calculate Average Velocity on a Velocity-Time Graph
Understanding how to calculate average velocity from a velocity-time graph is a fundamental concept in physics and crucial for many applications. This comprehensive guide will walk you through the process, covering various scenarios and providing practical examples to solidify your understanding. We'll explore different methods, including graphical interpretations and mathematical calculations, ensuring you can confidently tackle any velocity-time graph problem.
Understanding Velocity and Velocity-Time Graphs
Before diving into calculations, let's refresh our understanding of key terms:
-
Velocity: Velocity is a vector quantity, meaning it has both magnitude (speed) and direction. It measures the rate of change of an object's position. Units are typically meters per second (m/s) or kilometers per hour (km/h).
-
Velocity-Time Graph: A velocity-time graph plots velocity on the y-axis and time on the x-axis. The slope of the line at any point represents the acceleration, while the area under the curve represents the displacement.
Calculating Average Velocity: The Fundamentals
Average velocity is the total displacement divided by the total time taken. This differs from average speed, which is the total distance traveled divided by the total time taken. The distinction is crucial because displacement considers direction, while distance does not.
Formula:
Average Velocity = Total Displacement / Total Time
Where:
- Total Displacement: The net change in position (final position - initial position).
- Total Time: The total time interval considered.
Method 1: Using the Graphical Approach
For many velocity-time graphs, especially those with straight-line segments, a graphical approach is the most intuitive and efficient method for calculating average velocity.
Step-by-Step Guide for Graphical Calculation:
-
Identify the Initial and Final Velocities: Locate the velocity values at the beginning and end of the time interval you're interested in.
-
Determine the Total Time: Find the difference between the initial and final times on the x-axis.
-
Calculate the Total Displacement: This is where the graphical interpretation comes in. The area under the velocity-time curve represents the displacement. For simple shapes like rectangles and triangles, the area calculation is straightforward:
- Rectangle: Area = base (time) × height (velocity)
- Triangle: Area = ½ × base (time) × height (change in velocity)
For more complex shapes, you might need to break them down into smaller, simpler shapes (rectangles, triangles) and sum the individual areas.
-
Calculate the Average Velocity: Divide the total displacement (area under the curve) by the total time.
Example:
Let's say a velocity-time graph shows a constant velocity of 10 m/s for 5 seconds, followed by a period of constant deceleration to 0 m/s over 2 seconds.
- Initial Velocity: 10 m/s
- Final Velocity: 0 m/s
- Total Time: 5s + 2s = 7s
- Displacement: Area = (10 m/s × 5s) + (½ × 2s × 10 m/s) = 50 m + 10 m = 60 m
- Average Velocity: 60 m / 7s ≈ 8.57 m/s
Method 2: Using the Mathematical Approach
For more complex velocity-time graphs with curves or non-uniform motion, a mathematical approach might be necessary. This often involves calculus.
Calculating Average Velocity with Calculus:
-
Represent the Velocity Function: If the graph is represented by a function, v(t), where v is velocity and t is time, you can use calculus to find the displacement.
-
Integrate the Velocity Function: The definite integral of the velocity function over the given time interval represents the displacement. This is denoted as:
Displacement = ∫v(t) dt (from t_initial to t_final)
-
Calculate the Average Velocity: Divide the displacement (obtained from integration) by the total time.
Example:
Let's assume the velocity is given by the function v(t) = 2t + 3 m/s, and we want to find the average velocity between t = 1s and t = 4s.
-
Integration: ∫(2t + 3) dt = t² + 3t (from t = 1 to t = 4)
-
Displacement: [(4² + 3(4)) - (1² + 3(1))] = (16 + 12) - (1 + 3) = 24 m
-
Total Time: 4s - 1s = 3s
-
Average Velocity: 24 m / 3s = 8 m/s
Handling Non-Uniform Motion: Cases with Acceleration and Deceleration
Velocity-time graphs often depict scenarios with varying acceleration and deceleration. The methods described above still apply, but you need to carefully consider the shapes formed by the graph.
-
Multiple Segments: Break the graph into distinct segments with consistent acceleration or deceleration, calculate the displacement for each segment, and sum them to get the total displacement.
-
Curved Graphs: For curved graphs, numerical integration methods (like the trapezoidal rule or Simpson's rule) may be necessary to approximate the area under the curve and thus the displacement. These methods are more advanced and typically covered in calculus courses.
Interpreting the Significance of Average Velocity
The average velocity provides a single value summarizing the overall motion during a specified time interval. While it doesn't represent the instantaneous velocity at every point, it gives valuable insights into the net displacement and the overall direction of motion.
For instance, in analyzing a car journey, the average velocity might be zero if the car returns to its starting point, even if it traveled a considerable distance. This highlights the critical difference between average velocity and average speed.
Practical Applications of Average Velocity Calculation
Calculating average velocity from a velocity-time graph has wide-ranging applications in various fields, including:
-
Physics: Analyzing projectile motion, understanding the motion of objects under various forces, determining the average speed of molecules in a gas.
-
Engineering: Designing and optimizing the performance of vehicles, aircraft, and other moving systems.
-
Sports Science: Evaluating the performance of athletes, analyzing their speed and acceleration during competitions.
-
Traffic Engineering: Modeling traffic flow, optimizing traffic light timings, and improving road safety.
-
Environmental Science: Studying the movement of pollutants, analyzing ocean currents, and predicting the spread of invasive species.
Conclusion
Mastering the calculation of average velocity from a velocity-time graph is a crucial skill in physics and related fields. Whether you employ the graphical approach for simpler graphs or use calculus for more complex situations, a thorough understanding of the underlying principles is key to accurate and insightful analysis. By practicing various examples and applying the methods described in this guide, you will develop the confidence and proficiency needed to tackle a wide range of velocity-time graph problems. Remember to always clearly define the time interval you're analyzing and to be mindful of the difference between average velocity and average speed. This distinction is critical for accurate interpretations of motion.
Latest Posts
Latest Posts
-
How Much Is 9 Ounces In Cups
Mar 28, 2025
-
Long Run Equilibrium In Perfect Competition Results In
Mar 28, 2025
-
A Lamp Hangs Vertically From A Cord
Mar 28, 2025
-
Calculate The Rotational Inertia Of A Meter Stick
Mar 28, 2025
-
What Is 4 To The Power Of 5
Mar 28, 2025
Related Post
Thank you for visiting our website which covers about How To Calculate Average Velocity On A Velocity Time Graph . We hope the information provided has been useful to you. Feel free to contact us if you have any questions or need further assistance. See you next time and don't miss to bookmark.
