Which Of The Following Is A Measure Of Central Tendency
News Leon
Mar 20, 2025 · 6 min read
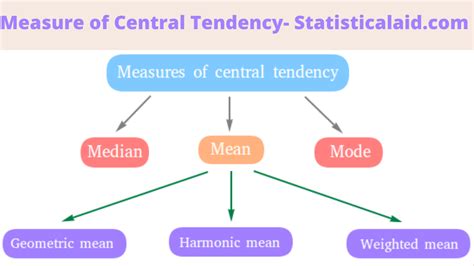
Table of Contents
Which of the Following is a Measure of Central Tendency? Understanding Mean, Median, and Mode
Measures of central tendency are crucial statistical concepts used to describe the center or typical value of a dataset. They provide a concise summary of the data, making it easier to understand and interpret. While several measures exist, the most common and widely used are the mean, median, and mode. Understanding the differences between these measures is key to selecting the appropriate one for a given dataset and avoiding misinterpretations. This article will delve deep into each measure, exploring their calculations, applications, and limitations. We'll also discuss when to use each and how to choose the best measure for your specific needs.
What is a Measure of Central Tendency?
A measure of central tendency is a single value that attempts to describe a dataset by identifying the central position within that dataset. Think of it as a representative value that summarizes the "typical" data point. Different measures achieve this representation in different ways, making them suitable for various data types and situations. Choosing the wrong measure can lead to misleading conclusions, so understanding their strengths and weaknesses is paramount.
The Mean: The Average We All Know
The mean, often referred to as the average, is perhaps the most familiar measure of central tendency. It's calculated by summing all the values in a dataset and then dividing by the number of values. The formula is straightforward:
Mean = Σx / n
Where:
- Σx represents the sum of all values in the dataset.
- n represents the number of values in the dataset.
Example: Let's say we have the following dataset: 2, 4, 6, 8, 10.
The sum (Σx) is 2 + 4 + 6 + 8 + 10 = 30. There are 5 values (n = 5). Therefore, the mean is 30 / 5 = 6.
Advantages of the Mean:
- Easy to calculate and understand: The formula is simple and widely known.
- Uses all data points: Every value in the dataset contributes to the calculation, making it a comprehensive measure.
- Sensitive to changes in the data: Any change in a data point will affect the mean, reflecting the overall changes in the dataset.
Disadvantages of the Mean:
- Sensitive to outliers: Extreme values (outliers) can significantly skew the mean, making it a poor representation of the central tendency in datasets with outliers. For instance, if we added a value of 100 to the above dataset, the mean would jump to 22, drastically altering the representation of the central tendency.
- Not suitable for skewed data: In datasets with a skewed distribution (where data is clustered more towards one end), the mean might not accurately reflect the typical value.
- Not applicable to categorical data: The mean can only be calculated for numerical data.
The Median: The Middle Value
The median is the middle value in a dataset when it's ordered from least to greatest. If the dataset has an even number of values, the median is the average of the two middle values.
Example:
- Odd number of values: In the dataset 2, 4, 6, 8, 10, the median is 6 (the middle value).
- Even number of values: In the dataset 2, 4, 6, 8, the median is (4 + 6) / 2 = 5.
Advantages of the Median:
- Robust to outliers: Outliers do not affect the median as significantly as they affect the mean. The median remains a better representation of the central tendency even in the presence of extreme values.
- Suitable for skewed data: Unlike the mean, the median provides a more accurate representation of the central tendency in skewed datasets.
- Can be used for ordinal data: The median can be used for data that can be ranked (ordinal data), even if the values aren't numerical.
Disadvantages of the Median:
- Doesn't use all data points: Only the middle value(s) are considered in the calculation.
- Less sensitive to changes in the data: Changes in data points, especially those far from the median, might not affect the median significantly.
The Mode: The Most Frequent Value
The mode is the value that appears most frequently in a dataset. A dataset can have one mode (unimodal), two modes (bimodal), or more (multimodal). If all values appear with equal frequency, there is no mode.
Example:
In the dataset 2, 4, 4, 6, 8, 10, the mode is 4 because it appears twice, more often than any other value.
Advantages of the Mode:
- Easy to understand and identify: It's simply the most frequent value.
- Suitable for categorical data: The mode can be used for categorical data (e.g., colors, brands) where the mean and median are not applicable.
- Unaffected by outliers: Outliers have no influence on the mode.
Disadvantages of the Mode:
- May not be unique: A dataset can have multiple modes, making it less informative.
- May not exist: If all values occur with the same frequency, there's no mode.
- Sensitive to small changes in frequencies: A slight change in the frequency of a value can alter the mode.
Choosing the Right Measure: A Practical Guide
The choice of the appropriate measure of central tendency depends on the nature of the data and the research question. Here's a guide to help you make the right decision:
- Symmetrical data with no outliers: The mean, median, and mode will be approximately equal. The mean is often preferred due to its comprehensive use of all data points.
- Skewed data or data with outliers: The median is generally the preferred measure as it's less sensitive to extreme values.
- Categorical data: The mode is the only applicable measure.
- Ordinal data: The median is usually the most appropriate measure.
- Understanding the context: Consider the purpose of your analysis. Are you trying to find a typical value, a representative value resistant to outliers, or the most common value? This will guide your selection.
Beyond the Basics: Exploring Other Measures
While the mean, median, and mode are the most common measures of central tendency, other measures exist, such as the:
- Geometric Mean: Used for data representing rates of change or ratios. It's calculated by multiplying all values and then taking the nth root.
- Harmonic Mean: Used when dealing with rates or ratios where the reciprocal values are relevant.
- Midrange: The average of the highest and lowest values in a dataset. It's a simple but very sensitive measure affected by outliers.
- Winsorized Mean: A modified mean where extreme values are replaced with less extreme values before calculating the mean. This helps reduce the impact of outliers.
- Trimmed Mean: Similar to the Winsorized mean, but instead of replacing extreme values, a certain percentage of extreme values are removed from both ends of the dataset before calculating the mean.
These alternative measures offer specialized applications, but the mean, median, and mode remain the fundamental tools for understanding central tendency in most situations.
Conclusion: Making Sense of Your Data
Understanding measures of central tendency is crucial for effectively summarizing and interpreting data. By understanding the strengths and weaknesses of the mean, median, and mode, and considering the specific characteristics of your dataset, you can choose the most appropriate measure to accurately represent the central tendency of your data. This understanding allows for more accurate analysis, more insightful conclusions, and a deeper understanding of the information you're working with. Remember to always consider the context and the research questions when selecting a measure of central tendency to avoid misinterpretations and ensure your analysis accurately reflects the reality of your data. The careful application of these measures is fundamental to effective data analysis and interpretation.
Latest Posts
Latest Posts
-
How Many Orbitals In The N 3 Shell
Mar 20, 2025
-
Which Of The Following Is Not A Type Of Rna
Mar 20, 2025
-
An External User Of Accounting Information
Mar 20, 2025
-
Computer Programs Are Also Known As
Mar 20, 2025
-
Atp Is Called The Energy Currency Of The Cell Because
Mar 20, 2025
Related Post
Thank you for visiting our website which covers about Which Of The Following Is A Measure Of Central Tendency . We hope the information provided has been useful to you. Feel free to contact us if you have any questions or need further assistance. See you next time and don't miss to bookmark.
