Which Of The Following Graphs Represents A Function
News Leon
Mar 22, 2025 · 6 min read
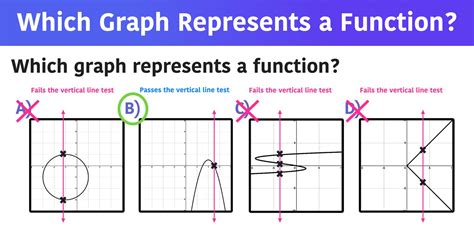
Table of Contents
Which of the Following Graphs Represents a Function? A Comprehensive Guide
Determining whether a graph represents a function is a fundamental concept in algebra and pre-calculus. Understanding this allows you to analyze relationships between variables and predict outcomes. This comprehensive guide will explore the concept of functions, the vertical line test, and how to identify functions from various graphical representations. We'll delve into different types of functions and provide numerous examples to solidify your understanding.
Understanding Functions: The Core Concept
A function is a special type of relationship between two sets of values, typically denoted as x (input) and y (output). For every single input value (x), there can only be one corresponding output value (y). This is the crucial defining characteristic of a function. Think of a function like a machine: you put in an input, and it produces a single, predictable output.
Key Terminology
Before we dive into graphical representations, let's clarify some key terms:
- Domain: The set of all possible input values (x) for the function.
- Range: The set of all possible output values (y) for the function.
- Mapping: The process of associating each input value with its corresponding output value.
The Vertical Line Test: Your Graphical Weapon
The vertical line test is a simple yet powerful tool used to visually determine if a graph represents a function. The test works as follows:
- Draw a vertical line anywhere across the graph.
- Observe the intersections between the vertical line and the graph.
If the vertical line intersects the graph at only one point for every vertical line you draw, the graph represents a function. If the vertical line intersects the graph at more than one point, even just at one location, then the graph does not represent a function. This is because having multiple intersections means a single input value (x) is associated with multiple output values (y), violating the fundamental rule of a function.
Examples of Functional and Non-Functional Graphs
Let's illustrate the vertical line test with various examples:
Example 1: A Function
Imagine a straight line with a positive slope. No matter where you draw a vertical line, it will intersect the line at only one point. Therefore, this graph represents a function. This is typical of linear functions like y = 2x + 1.
Example 2: Not a Function
Consider a circle. If you draw a vertical line through the circle, it will intersect the circle at two points. Because one x-value corresponds to two different y-values, this graph does not represent a function.
Example 3: A Parabola – A Function
A parabola that opens upwards or downwards (a quadratic function like y = x²) represents a function. A vertical line will intersect the parabola at most once.
Example 4: A sideways Parabola – Not a Function
A parabola that opens sideways (a quadratic function solved for x, such as x = y²) is not a function. A vertical line will intersect it at two points for most x-values.
Example 5: A More Complex Function
Consider a graph depicting a more complex relationship. The vertical line test remains the same; if any vertical line crosses the graph more than once, the graph doesn’t depict a function.
Different Types of Functions and Their Graphical Representations
Several types of functions frequently appear in mathematics. Let’s examine their typical graphical representations and how the vertical line test applies:
1. Linear Functions
Linear functions have the general form y = mx + b, where m is the slope and b is the y-intercept. Their graphs are always straight lines. Since a straight line (except a vertical line) will always pass the vertical line test, linear functions (except vertical lines) are always functions.
2. Quadratic Functions
Quadratic functions have the general form y = ax² + bx + c, where a, b, and c are constants and a ≠ 0. Their graphs are parabolas. Parabolas that open upwards or downwards (where the parabola is not on its side) pass the vertical line test and therefore represent functions.
3. Polynomial Functions
Polynomial functions are functions of the form y = aₙxⁿ + aₙ₋₁xⁿ⁻¹ + ... + a₁x + a₀, where n is a non-negative integer and aₙ, aₙ₋₁, ..., a₁, a₀ are constants. Polynomial functions of even degree can fail the vertical line test if a portion of the graph is traced more than once, whereas those of odd degree usually (but not always) will pass the test.
4. Exponential Functions
Exponential functions have the form y = abˣ, where a and b are constants and b > 0, b ≠ 1. Their graphs are curves that increase or decrease rapidly. Exponential functions always represent functions.
5. Logarithmic Functions
Logarithmic functions are the inverses of exponential functions. They have the form y = logb(x). Logarithmic functions always represent functions (when the domain is defined appropriately to avoid issues).
6. Trigonometric Functions
Trigonometric functions, such as sine (y = sin(x)), cosine (y = cos(x)), and tangent (y = tan(x)), are periodic functions. While they are periodic, and their graphs repeat, they all pass the vertical line test and thus are functions.
7. Piecewise Functions
Piecewise functions are defined by different formulas over different intervals of their domains. They can sometimes fail the vertical line test if different pieces overlap at a given x-value producing different y-values, resulting in the graph failing the vertical line test.
Advanced Considerations: Implicit Functions and Relations
While we've focused on explicitly defined functions (where y is expressed directly in terms of x), many functions are defined implicitly. An equation like x² + y² = 25 (representing a circle) defines a relation, not necessarily a function. The vertical line test readily identifies such cases as non-functional.
A relation is simply a set of ordered pairs (x, y). A function is a special type of relation where each x-value is associated with only one y-value.
Practical Applications and Real-World Examples
Understanding functions and the ability to identify them graphically has vast applications in various fields:
- Physics: Modeling projectile motion, wave functions, and many other physical phenomena involves using functional relationships.
- Engineering: Designing circuits, analyzing structural stability, and optimizing systems often depend on understanding functional relationships.
- Economics: Modeling supply and demand, calculating marginal costs, and predicting market trends frequently utilize functions.
- Computer Science: Creating algorithms, designing data structures, and implementing software often involves working with functions.
The ability to determine if a graph represents a function is a critical skill applicable across diverse domains.
Conclusion: Mastering the Vertical Line Test
The vertical line test is an indispensable tool for quickly and accurately determining whether a graph represents a function. By applying this simple test and understanding the fundamental definition of a function, you can confidently analyze graphical representations and apply this knowledge to various mathematical and real-world situations. Remember to always consider the vertical line test as the primary means to evaluate functional relationships from graphical data. This allows you to correctly identify whether a given graph displays a function or simply a relation. Consistent application of this technique forms the basis of understanding more complex mathematical concepts and applying them within practical contexts.
Latest Posts
Latest Posts
-
The Ends Of A Long Bone Are Known As The
Mar 23, 2025
-
Electromagnetic Induction Means Charging Of An Electric Conductor
Mar 23, 2025
-
Integral Of 2xdx From 10 To 13
Mar 23, 2025
-
Cos Alpha Beta Cos Alpha Beta
Mar 23, 2025
-
Hardwork Is Key To Success Essay
Mar 23, 2025
Related Post
Thank you for visiting our website which covers about Which Of The Following Graphs Represents A Function . We hope the information provided has been useful to you. Feel free to contact us if you have any questions or need further assistance. See you next time and don't miss to bookmark.
