What Is The Relationship Between Marginal Product And Average Product
News Leon
Mar 22, 2025 · 6 min read
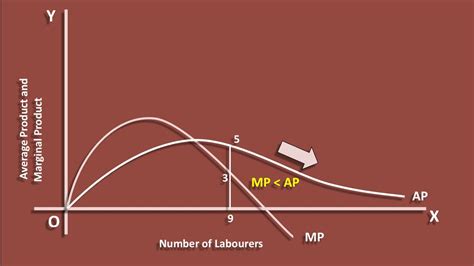
Table of Contents
The Intricate Dance of Marginal Product and Average Product: A Deep Dive
Understanding the relationship between marginal product (MP) and average product (AP) is crucial for any student or professional grappling with microeconomic principles. These two concepts are fundamental to analyzing production, efficiency, and ultimately, profit maximization. While seemingly distinct, MP and AP are intricately linked, with the movement of one directly influencing the trajectory of the other. This article will explore their definitions, their mathematical relationship, their graphical representation, and the implications of their interplay for firms' production decisions.
Defining Marginal Product and Average Product
Before delving into their relationship, let's clearly define each term:
Marginal Product (MP)
The marginal product of an input (typically labor) is the additional output produced by employing one more unit of that input, holding all other inputs constant. Think of it as the extra output you get from hiring one more worker, adding one more machine, or using one more unit of raw material, while keeping everything else the same. Mathematically, it's expressed as:
MP = ΔTotal Product (TP) / ΔInput (e.g., Labor)
where Δ represents the change. In simpler terms, it's the slope of the total product curve at any given point.
Average Product (AP)
The average product, on the other hand, represents the average output produced per unit of input. It's the total output divided by the total quantity of the input used. Mathematically, it's:
AP = Total Product (TP) / Input (e.g., Labor)
For instance, if 10 workers produce 50 units of output, the average product of labor is 5 units per worker.
The Mathematical Relationship: Where MP Shapes AP
The relationship between MP and AP is not arbitrary; it's a direct consequence of their definitions. The crucial insight is that the marginal product pulls the average product. This can be understood both intuitively and mathematically.
Intuitively: Imagine your average score on a series of tests. If you score higher than your average on the next test (your marginal score is higher than your average), your average score will rise. Conversely, if you score lower than your average, your average score will fall. This same principle applies to MP and AP in production.
Mathematically: We can derive a relationship between MP and AP using calculus. Let's assume 'L' represents the quantity of labor and 'TP' represents the total product. Then:
- AP = TP/L
- MP = dTP/dL (the derivative of TP with respect to L)
Using the quotient rule of differentiation, we can find the change in AP with respect to L:
dAP/dL = (L * dTP/dL - TP) / L²
Substituting MP = dTP/dL, we get:
dAP/dL = (L * MP - TP) / L²
This equation highlights the relationship: the change in AP depends on the difference between MP and AP.
- If MP > AP: The numerator (L * MP - TP) will be positive, implying that dAP/dL > 0. Therefore, the average product is increasing.
- If MP < AP: The numerator will be negative, resulting in dAP/dL < 0. This means the average product is decreasing.
- If MP = AP: The numerator is zero, leading to dAP/dL = 0. The average product is at its maximum.
This mathematical derivation confirms the intuitive understanding: the marginal product dictates the direction of the average product.
Graphical Representation: A Visual Depiction of the Relationship
The relationship between MP and AP is best visualized graphically. Typically, we plot both MP and AP against the quantity of labor (or any other input). The graph usually shows:
-
Initially, both MP and AP rise: This is the stage of increasing returns to scale. As you add more workers (initially), they become more efficient due to specialization and improved coordination. The additional output from each extra worker is high, pulling up both the marginal and average products. MP rises initially at a faster rate than AP.
-
MP reaches its maximum, then starts to decline: This is the point of diminishing marginal returns. As you continue adding workers, the extra output from each additional worker starts to decrease. The factory becomes overcrowded, workers start interfering with each other, and the gains from specialization are exhausted.
-
MP intersects AP at AP's maximum: This is a crucial point. When MP equals AP, the average product is at its maximum. Beyond this point, the falling MP pulls the AP down.
-
Both MP and AP decline: This reflects the stage of diminishing returns. Adding more workers leads to a decrease in both the average and marginal output. The factory is now severely over-crowded and productivity has significantly decreased.
Implications for Firms' Production Decisions
Understanding the relationship between MP and AP is critical for firms in making optimal production decisions:
-
Profit Maximization: Firms aim to maximize profits. This involves employing inputs up to the point where the marginal revenue product (MRP) – the additional revenue generated by an extra unit of input – equals the marginal cost (MC) of that input. The MP is a key component in calculating the MRP.
-
Optimal Input Levels: Firms need to determine the optimal level of input (e.g., labor) to employ. This optimal level is reached where the MP is equal to the average product, which in turn usually means that the average product is maximized at this point.
-
Cost Efficiency: By understanding the stages of production (increasing returns, diminishing marginal returns, diminishing returns), firms can identify the most cost-efficient level of input utilization. Operating beyond the point where MP intersects AP leads to diminishing returns and higher average costs.
-
Production Planning: The MP and AP curves help firms anticipate changes in output as they vary their input levels. This is crucial for effective production planning and forecasting.
Beyond Labor: Extending the Concepts to Other Inputs
While the examples above often focus on labor, the concepts of MP and AP apply to all inputs in the production process. This includes capital (machinery, equipment), raw materials, land, and even managerial expertise. The same principles—the relationship between marginal and average product, the stages of production, and the implications for optimal input levels—hold true for all inputs.
Advanced Considerations: Technological Change and Returns to Scale
The relationship between MP and AP can be significantly affected by technological advancements and the scale of production.
-
Technological Change: Technological improvements can shift both the MP and AP curves upwards. This is because new technologies often lead to increased productivity, allowing firms to produce more output with the same amount of inputs.
-
Returns to Scale: The shape of the MP and AP curves can also be influenced by returns to scale – how output changes in response to proportional changes in all inputs. Constant returns to scale lead to relatively stable AP, while increasing returns to scale can lead to continuously rising AP, and decreasing returns to scale will lead to a downward sloping average product curve.
Conclusion: A Foundation for Economic Understanding
The relationship between marginal product and average product is a fundamental concept in economics. Understanding this interplay is essential for analyzing production efficiency, making informed business decisions, and predicting the impact of technological change and varying input levels. By mastering the principles of MP and AP, both students and professionals can gain a deeper understanding of firm behavior and market dynamics. The interplay of these concepts provides a powerful framework for analyzing a wide range of economic phenomena. This article offers a comprehensive analysis of their relationship and the implications for economic decision-making in businesses.
Latest Posts
Latest Posts
-
In The Figure Two Particles Are Launched From The Origin
Mar 24, 2025
-
The Frequency Of The Second Hand On A Clock Is
Mar 24, 2025
-
How Many Neutrons Are In Magnesium 25
Mar 24, 2025
-
The Specific Amino Acid Sequence Of A Protein Is Its
Mar 24, 2025
-
Do Lone Pairs Count As Sigma Bonds
Mar 24, 2025
Related Post
Thank you for visiting our website which covers about What Is The Relationship Between Marginal Product And Average Product . We hope the information provided has been useful to you. Feel free to contact us if you have any questions or need further assistance. See you next time and don't miss to bookmark.
