What Does The Slope Of Velocity Time Graph Indicate
News Leon
Mar 20, 2025 · 6 min read
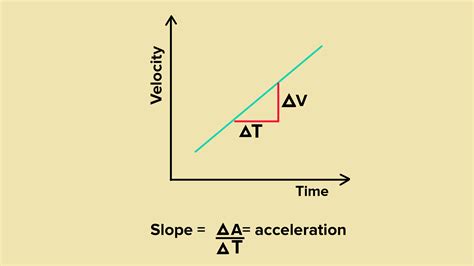
Table of Contents
What Does the Slope of a Velocity-Time Graph Indicate?
The slope of a velocity-time graph is a fundamental concept in physics, providing crucial information about an object's acceleration. Understanding this relationship is essential for analyzing motion and solving a wide range of physics problems. This article delves deep into the meaning of the slope, exploring its interpretation in different scenarios, including uniform and non-uniform motion, and its implications for calculating displacement. We'll also touch upon the significance of the area under the curve, which provides a different but equally important piece of information about the object's motion.
Understanding Velocity and Time Graphs
Before we delve into the meaning of the slope, let's establish a solid understanding of what a velocity-time graph represents. The graph plots velocity (usually on the y-axis) against time (on the x-axis). Each point on the graph represents the object's velocity at a specific point in time.
The graph's shape reveals significant information about the object's movement. A straight line indicates uniform motion (constant velocity), while a curved line indicates non-uniform motion (changing velocity).
The Slope as Acceleration: The Core Concept
The slope of a velocity-time graph represents the acceleration of the object. This is a critical relationship because it allows us to directly visualize and quantify the rate at which the object's velocity changes.
Mathematically, the slope is calculated as:
Slope = (Change in Velocity) / (Change in Time)
This is precisely the definition of acceleration: the rate of change of velocity. Therefore, a steep slope indicates a large acceleration (rapid change in velocity), while a shallow slope indicates a small acceleration (slow change in velocity).
Positive Slope: Positive Acceleration
A positive slope indicates positive acceleration. This means the object's velocity is increasing over time. The object is speeding up. This could be due to a constant force pushing the object in the direction of its motion.
Negative Slope: Negative Acceleration (Deceleration)
A negative slope indicates negative acceleration, also known as deceleration or retardation. This means the object's velocity is decreasing over time. The object is slowing down. This could be due to a force acting opposite to the direction of motion, such as friction or braking.
Zero Slope: Zero Acceleration (Constant Velocity)
A zero slope (a horizontal line) indicates zero acceleration. This means the object's velocity is constant; it's neither speeding up nor slowing down. The object is moving at a uniform velocity.
Interpreting Different Graph Shapes
Let's examine how the slope reveals the nature of motion in various scenarios:
1. Straight Line Graphs (Uniform Acceleration):
A straight line on a velocity-time graph signifies uniform acceleration. The slope remains constant, meaning the acceleration is constant throughout the motion. This is a simplified model, but it's useful for understanding fundamental concepts.
- Positive slope: Constant positive acceleration (e.g., a car accelerating at a constant rate).
- Negative slope: Constant negative acceleration (e.g., a car braking with constant force).
- Zero slope: Zero acceleration (constant velocity) (e.g., a car cruising at a steady speed).
2. Curved Line Graphs (Non-uniform Acceleration):
A curved line indicates non-uniform acceleration. The slope is constantly changing, meaning the acceleration is not constant. The steeper the curve, the greater the magnitude of the acceleration at that point.
- Curve with increasing slope: Acceleration is increasing.
- Curve with decreasing slope: Acceleration is decreasing.
- Curve with a changing sign of slope: The direction of acceleration changes (e.g., an object thrown upwards – it experiences a constant downward acceleration due to gravity but its velocity changes from upward to downward).
Calculating Acceleration from the Slope
To numerically determine the acceleration, you need to calculate the slope of the velocity-time graph. This involves selecting two points on the line (or, for a curve, at a specific point, using the tangent line) and using the slope formula:
Acceleration (a) = (v₂ - v₁) / (t₂ - t₁)
Where:
- v₂ is the final velocity
- v₁ is the initial velocity
- t₂ is the final time
- t₁ is the initial time
Beyond the Slope: The Area Under the Curve
While the slope provides crucial information about the acceleration, the area under the velocity-time graph represents the displacement of the object. This is another critical piece of information that can be extracted from the graph.
For a simple rectangular area (constant velocity), the displacement is just:
Displacement = Velocity × Time
For more complex shapes, you might need to use calculus (integration) to find the exact area. However, approximating the area using techniques like dividing it into smaller rectangles or trapezoids provides a good estimate of the displacement.
Practical Applications and Real-World Examples
Understanding the slope of a velocity-time graph is not just a theoretical exercise; it has numerous practical applications across various fields:
- Engineering: Analyzing the motion of vehicles, designing efficient braking systems, and studying the performance of machinery.
- Sports science: Analyzing the performance of athletes, optimizing training programs, and understanding the dynamics of movement.
- Aerospace engineering: Studying the flight paths of aircraft, designing control systems, and understanding the effects of aerodynamic forces.
- Physics research: Investigating the motion of particles, studying collisions, and exploring fundamental physical laws.
Advanced Concepts and Considerations
- Vectors: In reality, velocity and acceleration are vector quantities, meaning they have both magnitude and direction. Velocity-time graphs often simplify this by considering only one dimension (e.g., motion along a straight line).
- Calculus: For non-uniform acceleration, calculus is needed to precisely calculate the acceleration and displacement. The slope of the tangent line at any point on the curve represents the instantaneous acceleration at that moment. The area under the curve is found through integration.
- Multiple Dimensions: Extending the concept to two or three dimensions requires more complex graphical representations and mathematical techniques.
Conclusion: A Powerful Tool for Analyzing Motion
The slope of a velocity-time graph is a powerful tool for understanding and analyzing motion. By understanding its relationship to acceleration and displacement, and by being able to interpret different graph shapes, you gain a profound insight into the dynamics of motion. This knowledge is invaluable across numerous fields, providing a strong foundation for solving problems and advancing our understanding of the physical world. Whether dealing with uniform or non-uniform motion, the ability to extract information from velocity-time graphs is essential for any student or professional working with motion analysis. The concepts discussed here serve as a cornerstone of kinematics and form a vital link to more advanced topics in physics and engineering. Remember that practice is key – the more you work with these graphs, the more intuitive their interpretation will become.
Latest Posts
Latest Posts
-
Give The Constituents Of Baking Powder
Mar 21, 2025
-
Which Of The Following Types Of Muscles Is Voluntary Muscle
Mar 21, 2025
-
Which Of The Following Is Not A Vector Quantity
Mar 21, 2025
-
How Many Irrational Numbers Are There Between 1 And 6
Mar 21, 2025
-
Identify The Incorrect Statement Regarding The Vitreous Body
Mar 21, 2025
Related Post
Thank you for visiting our website which covers about What Does The Slope Of Velocity Time Graph Indicate . We hope the information provided has been useful to you. Feel free to contact us if you have any questions or need further assistance. See you next time and don't miss to bookmark.
