What Does The Slope Of A Velocity Time Graph Indicate
News Leon
Mar 18, 2025 · 6 min read
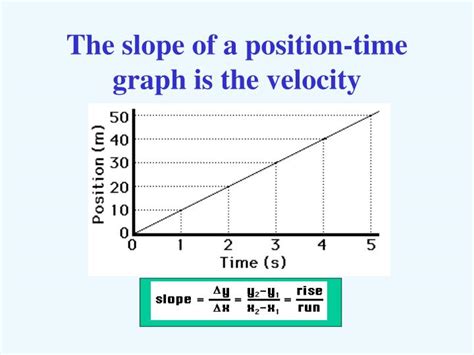
Table of Contents
What Does the Slope of a Velocity-Time Graph Indicate?
The slope of a velocity-time graph is a fundamental concept in physics, providing crucial insights into an object's acceleration. Understanding this relationship is essential for analyzing motion and predicting future behavior. This article will delve deep into the meaning of the slope, exploring its implications, different scenarios, and practical applications. We'll cover various types of motion, from constant velocity to complex, non-uniform acceleration, and show you how to interpret the information conveyed by the graph's slope.
Understanding Velocity and Time Graphs
Before we dive into the slope, let's establish a clear understanding of velocity-time graphs themselves. These graphs plot velocity (usually on the y-axis) against time (on the x-axis). The resulting line or curve visually represents the object's motion over a given period. Each point on the graph corresponds to the object's velocity at a specific moment in time.
Key Features of Velocity-Time Graphs:
-
Horizontal Line: Represents constant velocity. The object is moving at a steady speed in a single direction. The slope of a horizontal line is zero, indicating zero acceleration.
-
Upward Sloping Line: Indicates positive acceleration. The object's velocity is increasing over time. The steeper the slope, the greater the acceleration.
-
Downward Sloping Line: Shows negative acceleration (or deceleration). The object's velocity is decreasing over time. The steeper the slope, the greater the deceleration.
-
Curved Line: Represents non-uniform acceleration. The object's acceleration is changing over time. The slope of the curve at any point represents the instantaneous acceleration at that precise moment.
The Slope as Acceleration: A Mathematical Perspective
The slope of a velocity-time graph is mathematically defined as the change in velocity divided by the change in time. This is precisely the definition of acceleration:
Acceleration (a) = (Change in Velocity (Δv)) / (Change in Time (Δt))
This means that the slope of the line connecting two points on the velocity-time graph directly provides the average acceleration between those two points. If the graph is a straight line, the acceleration is constant. If the graph is curved, the acceleration is changing, and the slope at any particular point gives the instantaneous acceleration at that point.
Analyzing Different Scenarios
Let's explore various scenarios and how the slope of the velocity-time graph translates to the object's motion:
1. Constant Velocity (Zero Acceleration)
Imagine a car driving at a steady 60 km/h on a straight highway. The velocity-time graph would be a horizontal line at 60 km/h. The slope of this horizontal line is zero, indicating zero acceleration. The car is maintaining a constant velocity without speeding up or slowing down.
2. Constant Positive Acceleration
Consider a rocket launching into space. Its velocity increases steadily as it ascends. The velocity-time graph would be a straight line with a positive slope. The steeper the slope, the greater the rocket's acceleration. A steeper slope signifies a faster rate of velocity increase.
3. Constant Negative Acceleration (Deceleration)
A car braking to a stop displays constant negative acceleration. The velocity-time graph will be a straight line with a negative slope. The steeper the negative slope, the faster the car decelerates, indicating a stronger braking force. The line will eventually intersect the x-axis (time axis) at the point when the car comes to a complete stop.
4. Non-Uniform Acceleration
A more complex scenario involves a car accelerating from rest, maintaining a constant speed, and then braking to a halt. The velocity-time graph will be a curve, composed of three distinct sections:
- An upward-sloping curve: Represents the initial acceleration phase. The slope continuously changes, indicating a varying acceleration.
- A horizontal line: Represents the constant speed phase (zero acceleration).
- A downward-sloping curve: Represents the deceleration phase as the car brakes. Again, the slope varies continuously.
To find the acceleration at any specific point in this non-uniform motion, you would need to determine the slope of the tangent line at that point on the curve.
Calculating Acceleration from the Slope
Calculating the acceleration from the slope is straightforward:
- Select two points on the velocity-time graph. These points define a time interval (Δt) and the corresponding change in velocity (Δv).
- Determine the change in velocity (Δv): Subtract the initial velocity from the final velocity.
- Determine the change in time (Δt): Subtract the initial time from the final time.
- Calculate the acceleration (a): Divide the change in velocity (Δv) by the change in time (Δt).
Example:
Let's say a point A on the graph represents a velocity of 10 m/s at time t=2 seconds, and point B represents a velocity of 30 m/s at time t=6 seconds.
- Δv = 30 m/s - 10 m/s = 20 m/s
- Δt = 6 s - 2 s = 4 s
- a = Δv / Δt = 20 m/s / 4 s = 5 m/s²
The average acceleration between points A and B is 5 m/s².
Practical Applications
The ability to interpret velocity-time graphs and understand their slopes has numerous practical applications across various fields:
- Engineering: Designing and analyzing the performance of vehicles, rockets, and other moving systems.
- Sports Science: Evaluating the performance of athletes by analyzing their speed and acceleration during training and competitions.
- Traffic Engineering: Modeling traffic flow and optimizing traffic management strategies.
- Physics Education: A fundamental tool for teaching and understanding concepts of motion and dynamics.
- Data Analysis: In any field where motion data is collected, velocity-time graphs are powerful tools for visualization and interpretation.
Advanced Considerations: Instantaneous Acceleration and Calculus
For curves representing non-uniform acceleration, the average acceleration between two points doesn't fully capture the nuances of the motion. To determine the acceleration at a specific instant (instantaneous acceleration), calculus is required. The instantaneous acceleration is given by the derivative of the velocity function with respect to time:
a(t) = dv/dt
This derivative represents the slope of the tangent line to the velocity-time curve at a specific point in time. For simple curves, the tangent slope can be estimated graphically, but for complex curves, numerical or analytical methods are often necessary.
Conclusion
The slope of a velocity-time graph provides a clear and concise way to understand and analyze the acceleration of an object. Whether the motion is characterized by constant velocity, constant acceleration, or non-uniform acceleration, the slope serves as a critical tool for interpretation. By mastering the relationship between the slope and acceleration, you gain a powerful understanding of motion and its implications across various fields of study and application. Understanding this fundamental concept is crucial for anyone working with motion analysis or pursuing studies in physics, engineering, or related disciplines. The ability to effectively interpret velocity-time graphs empowers you to draw insightful conclusions, make informed predictions, and solve complex problems related to motion.
Latest Posts
Latest Posts
-
Which Of The Following Is Not A Form Of Precipitation
Mar 18, 2025
-
Which Statement About Natural Selection Is True
Mar 18, 2025
-
Which Chamber Of Heart Has Thickest Wall
Mar 18, 2025
-
How Many Feet Is 1 2 Miles
Mar 18, 2025
-
How Many Valence Electrons Does Mn Have
Mar 18, 2025
Related Post
Thank you for visiting our website which covers about What Does The Slope Of A Velocity Time Graph Indicate . We hope the information provided has been useful to you. Feel free to contact us if you have any questions or need further assistance. See you next time and don't miss to bookmark.
