What Does The Slope Of A Distance Time Graph Indicate
News Leon
Mar 20, 2025 · 6 min read
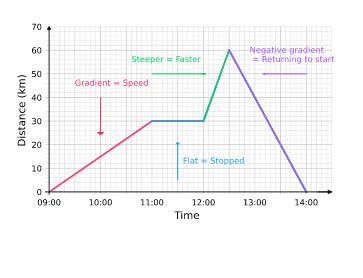
Table of Contents
What Does the Slope of a Distance-Time Graph Indicate?
Understanding the relationship between distance and time is fundamental to physics and many real-world applications. A distance-time graph provides a visual representation of this relationship, with distance plotted on the y-axis and time on the x-axis. The most crucial aspect of interpreting this graph is understanding what the slope of the line represents. This article will delve deep into the meaning of the slope of a distance-time graph, exploring its significance, different scenarios, and applications.
The Slope as Speed: A Fundamental Concept
The slope of a distance-time graph represents the speed of an object. This is a key concept that forms the basis for understanding motion. Remember that the slope of a line is calculated as the change in the y-axis value divided by the change in the x-axis value. In a distance-time graph:
- Change in y-axis (Δy): Represents the change in distance (Δd)
- Change in x-axis (Δx): Represents the change in time (Δt)
Therefore, the slope is calculated as:
Slope = Δd/Δt = (d₂ - d₁)/(t₂ - t₁)
Where:
- d₂ is the final distance
- d₁ is the initial distance
- t₂ is the final time
- t₁ is the initial time
This formula is identical to the formula for calculating average speed. This means the slope directly gives you the average speed of the object during the time interval considered.
Interpreting Different Slopes: What they Tell Us About Motion
The slope of the distance-time graph provides valuable insights into the nature of the object's motion. Let's examine various scenarios:
1. Positive Slope: Motion in a Single Direction
A positive slope indicates that the object is moving in a specific direction, and its distance from the starting point is increasing with time. The steeper the slope, the faster the object is moving. A straight line with a positive slope represents constant speed – the object covers the same distance in each equal time interval.
2. Zero Slope: Object at Rest
A zero slope (a horizontal line) indicates that the object is stationary or at rest. The distance remains constant over time, implying no movement.
3. Negative Slope: Motion in the Opposite Direction
A negative slope (a line sloping downwards from left to right) indicates that the object is moving in the opposite direction to its initial direction. The distance from the starting point is decreasing with time. The steeper the negative slope, the faster the object is moving in the opposite direction. It's important to understand that this doesn't necessarily mean the object's speed is negative. Speed is always a positive quantity, while velocity (which also considers direction) can be negative.
4. Curved Line: Changing Speed
A curved line on a distance-time graph indicates that the object's speed is changing over time. This could represent acceleration (increasing speed) or deceleration (decreasing speed). The slope at any point on the curve gives the instantaneous speed at that specific time. Calculating instantaneous speed involves using calculus, specifically finding the derivative of the distance function with respect to time. However, you can approximate instantaneous speed by calculating the slope of a tangent line to the curve at the point of interest.
Applications of Distance-Time Graphs and Slope Interpretation
The ability to interpret the slope of a distance-time graph is crucial in numerous fields:
1. Physics and Kinematics:
Distance-time graphs are foundational in kinematics, the study of motion. Analyzing the slope allows physicists to determine the speed, acceleration, and overall motion characteristics of objects. This is essential in understanding projectile motion, circular motion, and other complex movement patterns.
2. Transportation and Navigation:
In transportation, understanding the relationship between distance and time is critical for planning routes, estimating travel times, and monitoring vehicle speed. GPS systems often utilize distance-time data to provide real-time location updates and navigation instructions.
3. Sports Science and Training:
In sports, distance-time graphs can track athletes' performance, analyze their speed and endurance, and help design personalized training programs. The slope analysis can reveal crucial information about speed variations during a race or workout, identifying areas for improvement.
4. Meteorology and Climate Science:
In meteorology, distance-time graphs can be used to track the movement of weather systems like storms or hurricanes. Analyzing the slope helps meteorologists predict the path and speed of these systems, enabling timely warnings and disaster preparedness.
5. Engineering and Design:
Engineers use distance-time graphs to model and analyze the movement of mechanical components in machines and systems. This is crucial in ensuring efficient operation and preventing malfunctions.
Beyond Average Speed: Understanding Instantaneous Speed and Acceleration
While the slope of a straight line on a distance-time graph directly provides the average speed, interpreting the motion of an object whose speed is changing requires a more sophisticated understanding.
Instantaneous Speed
For a curved line, the slope at any particular point represents the instantaneous speed at that specific moment in time. This is a more precise measure of speed than the average speed calculated over a larger time interval. Mathematically, the instantaneous speed is the derivative of the distance with respect to time.
Acceleration
The rate of change of speed is called acceleration. While a distance-time graph directly shows speed (through its slope), it doesn't directly show acceleration. However, by examining how the slope itself changes over time, you can infer the presence of acceleration. A consistently increasing slope suggests positive acceleration (speeding up), while a consistently decreasing slope suggests negative acceleration (slowing down). To quantitatively determine acceleration, you would need a speed-time graph or use calculus to find the second derivative of the distance function with respect to time.
Practical Examples and Exercises
Let’s consider a few examples to solidify the concepts discussed:
Example 1: A car travels 100 km in 2 hours. The distance-time graph would show a straight line with a positive slope. The slope (100 km/2 hours = 50 km/hour) represents the average speed of the car.
Example 2: A cyclist stops for a break during a ride. The distance-time graph would show a horizontal line (zero slope) during the break period, indicating zero speed.
Example 3: A ball is thrown upward, reaches its peak, and then falls back down. The distance-time graph would be a curve. The slope initially decreases (negative acceleration due to gravity), becomes zero at the peak, and then increases negatively (still negative acceleration).
Exercise: Imagine a distance-time graph depicting a journey. The graph starts with a steep positive slope, then levels off to a gentler positive slope, before ending with a steeper negative slope. Describe the journey based on the slope changes.
Conclusion: The Power of Visual Representation in Understanding Motion
The slope of a distance-time graph is a powerful tool for understanding and analyzing motion. Whether it’s a straight line indicating constant speed or a curve representing changing speed, the slope directly relates to the speed of the object and, by extension, provides insights into its acceleration and overall movement pattern. Understanding this relationship is fundamental in various scientific, engineering, and practical applications, helping us interpret data, make predictions, and improve our understanding of the world around us. By mastering the interpretation of distance-time graphs, you unlock a key to understanding the fundamentals of motion and its diverse applications.
Latest Posts
Latest Posts
-
A Solenoid That Is 95 0 Cm
Mar 21, 2025
-
Is Water A Conductor Or Insulator
Mar 21, 2025
-
What Number Is Divisible By 3 And 4
Mar 21, 2025
-
What Is The Greatest Common Factor Of 36 And 54
Mar 21, 2025
-
Which Layer Of The Skin Does Not Contain Blood Vessels
Mar 21, 2025
Related Post
Thank you for visiting our website which covers about What Does The Slope Of A Distance Time Graph Indicate . We hope the information provided has been useful to you. Feel free to contact us if you have any questions or need further assistance. See you next time and don't miss to bookmark.
