Ventricular Repolarization Is Represented By The
News Leon
Mar 17, 2025 · 6 min read
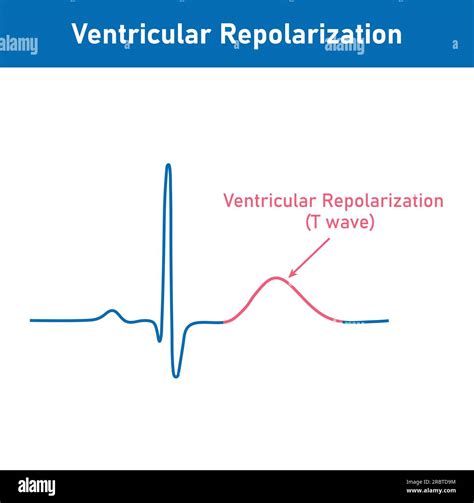
Table of Contents
Ventricular Repolarization: Unveiling the Secrets of the T Wave
Ventricular repolarization, a crucial phase in the cardiac cycle, is electrically represented by the T wave on the electrocardiogram (ECG). Understanding this process is vital for interpreting ECGs, diagnosing cardiac abnormalities, and appreciating the complex interplay of ions that govern the heart's rhythmic contractions. This comprehensive article delves into the intricacies of ventricular repolarization, exploring its mechanisms, ECG manifestations, clinical significance, and the factors influencing its duration and morphology.
The Mechanics of Ventricular Repolarization
Ventricular repolarization is the process by which the ventricular myocytes (heart muscle cells) return to their resting membrane potential after depolarization. Unlike depolarization, which is a rapid and synchronized event, repolarization is a more gradual and heterogeneous process. This complexity arises from variations in ion channel expression and activity across different regions of the ventricles.
Phase 1: Early Repolarization
This initial phase is characterized by a transient outward current (Ito), primarily mediated by potassium channels. This outward potassium current leads to a slight initial repolarization, albeit modest compared to the subsequent phases.
Phase 2: Plateau Phase
The plateau phase represents a period of relative stability in the membrane potential. During this time, the inward calcium current (Ica) largely balances the outward potassium current, maintaining the membrane potential near its peak. This prolonged depolarization is critical for the effective contraction of the ventricles.
Phase 3: Rapid Repolarization
The rapid repolarization phase is dominated by an increase in the outward potassium current, primarily through delayed rectifier potassium channels (IKr and IKs). The significant increase in potassium efflux rapidly repolarizes the ventricular myocytes, bringing the membrane potential back towards its resting state.
Phase 4: Resting Membrane Potential
Once the membrane potential reaches its resting level, the cell is fully repolarized and ready for the next cycle of depolarization and contraction. This resting potential is maintained by the sodium-potassium pump, which actively transports sodium ions out of the cell and potassium ions into the cell.
The T Wave: A Graphical Representation of Repolarization
The T wave, a prominent feature of the ECG, directly reflects the electrical activity associated with ventricular repolarization. Its characteristics provide valuable insights into the overall health and function of the ventricles.
T Wave Morphology: What it Tells Us
The morphology (shape and size) of the T wave is crucial for interpretation. A normally shaped T wave is typically upright and rounded, with a smooth contour. Inversions, flattening, peaking, and asymmetry can indicate underlying cardiac pathology. For instance:
- Inverted T waves: Can indicate myocardial ischemia, electrolyte imbalances (hypokalemia), or left ventricular hypertrophy.
- Flattened T waves: Often associated with myocardial ischemia or electrolyte disturbances.
- Peaked T waves: Can signify hyperkalemia (elevated potassium levels).
- Asymmetrical T waves: May suggest myocardial infarction or other structural heart abnormalities.
The amplitude (height) and duration of the T wave also hold diagnostic significance. Variations in these parameters can reflect changes in ventricular repolarization and potentially underlying cardiac conditions.
Relationship between QT Interval and T Wave
The QT interval, representing the entire duration of ventricular depolarization and repolarization, is closely related to the T wave. Prolongation of the QT interval (long QT syndrome) can predispose individuals to potentially life-threatening ventricular arrhythmias, often manifested by a prominent, prolonged T wave.
Clinical Significance of Ventricular Repolarization Abnormalities
Abnormalities in ventricular repolarization can have significant clinical implications, often indicating underlying cardiac disease. Accurate interpretation of the T wave and related ECG parameters is therefore critical for diagnosis and management.
Myocardial Ischemia and Infarction
Myocardial ischemia (reduced blood flow to the heart muscle) and myocardial infarction (heart attack) frequently manifest as changes in the T wave morphology. Ischemia typically presents with T wave inversions or flattening, reflecting the disruption of normal repolarization. Infarction can lead to more significant alterations, including ST segment elevation and pathological Q waves, alongside profound T wave changes.
Electrolyte Imbalances
Electrolyte imbalances, especially those involving potassium, magnesium, and calcium, significantly influence ventricular repolarization. Hypokalemia (low potassium) often results in flattened or inverted T waves, while hyperkalemia (high potassium) can lead to peaked T waves and potentially life-threatening arrhythmias.
Cardiac Hypertrophy
Ventricular hypertrophy (enlargement of the heart muscle) can affect repolarization, often causing changes in T wave morphology and the QT interval. Left ventricular hypertrophy can, for example, cause T wave inversions in the lateral leads.
Conduction Abnormalities
Certain conduction disturbances, such as bundle branch blocks, can also impact repolarization, leading to variations in the T wave amplitude and morphology. These changes reflect the asynchronous repolarization of the ventricles.
Factors Influencing Ventricular Repolarization
Several factors modulate the process of ventricular repolarization, influencing the characteristics of the T wave and its clinical significance:
Autonomic Nervous System
The autonomic nervous system significantly influences repolarization. Sympathetic stimulation can shorten the QT interval and affect T wave morphology, while parasympathetic activation tends to have the opposite effect.
Medications
Numerous medications can impact ventricular repolarization. Some antiarrhythmic drugs, for instance, can prolong the QT interval, increasing the risk of torsades de pointes, a potentially fatal arrhythmia. Other drugs may shorten the QT interval.
Age and Gender
Age and gender can subtly influence ventricular repolarization. Older individuals may exhibit prolonged QT intervals compared to younger individuals. Gender differences in QT interval duration have also been reported.
Body Temperature
Body temperature affects ion channel activity and thus influences repolarization. Hypothermia slows repolarization, prolonging the QT interval, whereas hyperthermia has the opposite effect.
Advanced Considerations: Repolarization Dispersion and Arrhythmias
Repolarization dispersion, the temporal heterogeneity of repolarization across the ventricles, is a critical factor in the development of ventricular arrhythmias. When repolarization is uneven, it creates a substrate for re-entrant circuits, leading to potentially life-threatening arrhythmias. This highlights the importance of understanding the intricate interplay of ion channels and their spatial distribution within the myocardium.
Long QT Syndrome
Long QT syndrome (LQTS) encompasses a group of inherited cardiac conditions characterized by a prolonged QT interval. LQTS significantly increases the risk of potentially fatal ventricular arrhythmias like torsades de pointes. Understanding the genetic basis of LQTS and its ECG manifestations is essential for early diagnosis and preventative measures.
Brugada Syndrome
Brugada syndrome is another inherited cardiac disorder characterized by specific ECG findings, including ST-segment elevation in the right precordial leads and a distinctive T-wave morphology. These ECG changes reflect an abnormality in ventricular repolarization, which predisposes individuals to life-threatening ventricular arrhythmias.
Conclusion: The T Wave as a Window into the Heart
The T wave, a seemingly simple component of the ECG, provides a window into the complex process of ventricular repolarization. Its morphology, amplitude, and duration, combined with the QT interval, offer crucial diagnostic information. Understanding the factors that influence ventricular repolarization, including underlying cardiac conditions, electrolyte imbalances, and the impact of medications, is vital for accurate interpretation of ECG findings and effective patient management. Further research continues to unravel the intricacies of this critical phase of the cardiac cycle, leading to improved diagnostic tools and therapeutic strategies for managing cardiac arrhythmias and other heart conditions. Careful assessment of the T wave and its associated parameters remains a cornerstone of electrocardiographic interpretation and cardiovascular care. Appreciating the nuances of ventricular repolarization is crucial for clinicians involved in the diagnosis and treatment of a wide range of cardiac conditions.
Latest Posts
Latest Posts
-
Which Statement About Natural Selection Is True
Mar 18, 2025
-
Which Chamber Of Heart Has Thickest Wall
Mar 18, 2025
-
How Many Feet Is 1 2 Miles
Mar 18, 2025
-
How Many Valence Electrons Does Mn Have
Mar 18, 2025
-
Lines Of Symmetry On A Trapezoid
Mar 18, 2025
Related Post
Thank you for visiting our website which covers about Ventricular Repolarization Is Represented By The . We hope the information provided has been useful to you. Feel free to contact us if you have any questions or need further assistance. See you next time and don't miss to bookmark.
