The Marginal Cost Curve Intersects The Average Total Cost Curve
News Leon
Mar 23, 2025 · 6 min read
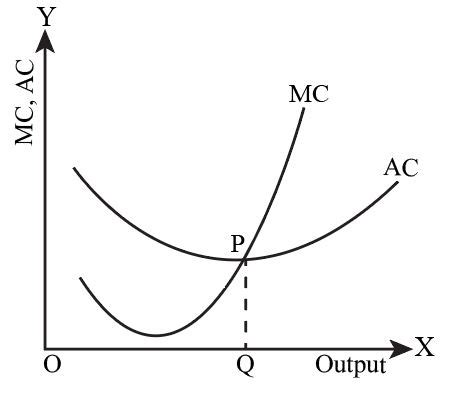
Table of Contents
The Marginal Cost Curve Intersects the Average Total Cost Curve: An In-Depth Analysis
Understanding cost curves is fundamental to mastering microeconomics. Among the most crucial relationships is the intersection of the marginal cost (MC) curve and the average total cost (ATC) curve. This intersection point reveals critical insights into a firm's production efficiency and profitability. This article will delve deep into this relationship, explaining the underlying principles, demonstrating why the intersection occurs, and exploring its implications for business decisions.
Understanding Cost Curves: A Foundation
Before we explore the intersection, let's define the key cost curves involved:
1. Marginal Cost (MC): The Cost of One More Unit
The marginal cost (MC) represents the additional cost incurred by producing one more unit of output. It's calculated as the change in total cost divided by the change in quantity. Mathematically:
MC = ΔTC / ΔQ
Where:
- ΔTC is the change in total cost
- ΔQ is the change in quantity
The MC curve is typically U-shaped. Initially, MC decreases due to increasing returns to scale (specialization and efficiency gains). However, as production increases further, diminishing returns set in, leading to rising MC.
2. Average Total Cost (ATC): Cost Per Unit of Output
The average total cost (ATC) represents the total cost per unit of output. It's calculated by dividing total cost (TC) by the quantity (Q) produced:
ATC = TC / Q
The ATC curve is also typically U-shaped. It reflects the interplay between average fixed costs (AFC) and average variable costs (AVC). Initially, ATC falls due to the decreasing AFC. However, as MC rises beyond the ATC, the increasing AVC eventually dominates, causing ATC to rise as well.
3. Average Variable Cost (AVC): Variable Cost Per Unit
The average variable cost (AVC) is the variable cost per unit of output. Variable costs are costs that change with the level of output (e.g., raw materials, labor). It is calculated as:
AVC = VC / Q
Where:
- VC is the total variable cost
- Q is the quantity of output
Like ATC and MC, the AVC curve is also typically U-shaped, influenced by the diminishing returns to scale.
The Intersection: Where MC Meets ATC
The crucial relationship between MC and ATC lies in their intersection. The MC curve always intersects the ATC curve at the ATC's minimum point. This is not a coincidence but a direct consequence of the mathematical relationship between these curves.
Think of it this way:
-
When MC < ATC: If the cost of producing one more unit (MC) is less than the average cost per unit (ATC), adding that unit will lower the average. Imagine your average test score: if your next test score is higher than your average, it pulls your average up; if it's lower, it pulls your average down. Similarly, if MC is below ATC, adding that unit pulls the average down.
-
When MC > ATC: Conversely, if the cost of producing one more unit (MC) is greater than the average cost per unit (ATC), adding that unit will raise the average. This continues until MC is equal to ATC.
-
When MC = ATC: Only when MC equals ATC does adding another unit neither raise nor lower the average. This is the minimum point of the ATC curve. Beyond this point, any additional units will cause the average total cost to rise.
Graphical Representation and Mathematical Proof
The relationship can be clearly visualized through a graph. The typical graph shows a U-shaped ATC curve, and a U-shaped MC curve cutting through the ATC curve at its minimum point. This visual representation reinforces the concept explained above.
While the graphical representation provides intuition, we can also demonstrate this mathematically. Recall that ATC = TC/Q. To find the minimum point of the ATC curve, we take the derivative with respect to Q and set it equal to zero:
d(ATC)/dQ = d(TC/Q)/dQ = 0
Using the quotient rule of differentiation, we get:
(Q * dTC/dQ - TC) / Q² = 0
This simplifies to:
Q * dTC/dQ = TC
Since dTC/dQ is the marginal cost (MC), we can rewrite the equation as:
Q * MC = TC
Dividing both sides by Q, we get:
MC = TC/Q
And since TC/Q = ATC, we finally arrive at:
MC = ATC
This confirms that the minimum point of the ATC curve occurs precisely where MC equals ATC.
Implications for Business Decisions
Understanding the relationship between the MC and ATC curves has significant implications for business decision-making:
1. Cost Minimization: Finding the Efficient Scale
The intersection point of MC and ATC at the minimum point of the ATC represents the efficient scale of production. This is the output level at which the firm minimizes its average total cost. Firms strive to operate at this point to maximize their profitability. Operating at a higher output level would increase average costs due to diminishing returns.
2. Production Decisions: Short-Run vs. Long-Run
In the short run, a firm might operate at an output level where MC > ATC, sacrificing efficiency for increased output. However, in the long run, firms should aim to adjust their production scale to reach the efficient scale where MC = ATC. This might involve expanding or contracting their operations, investing in new technology or optimizing their processes.
3. Pricing Strategies: Cost-Plus Pricing
While not directly derived from the MC-ATC relationship, this intersection point informs cost-plus pricing strategies. Understanding the minimum ATC helps businesses determine the minimum price at which they can sell their products while covering all costs and potentially making a profit.
4. Market Structure Analysis: Perfect Competition
In perfectly competitive markets, firms are price takers. They must produce where price equals marginal cost (P=MC) to maximize profit. The MC=ATC point gives insight into the long-run equilibrium in perfect competition. In the long run, firms will only remain in the market if they can cover all their costs, which means the price must at least be equal to ATC.
Beyond the Basic Model: Considering Other Factors
While the basic model highlights the fundamental relationship, real-world scenarios often involve more complexities:
-
Economies of Scale: Industries experiencing significant economies of scale will have a flatter and broader ATC curve, with the MC curve intersecting it at a lower point and a larger efficient scale.
-
Diseconomies of Scale: Conversely, industries facing diseconomies of scale (e.g., management inefficiencies at very large scales) will have a steeper ATC curve, with the MC intersecting it at a higher point and a smaller efficient scale.
-
Technological Advancements: Technological improvements can shift both the MC and ATC curves downwards, increasing efficiency and potentially expanding the efficient scale.
-
Changes in Input Prices: Fluctuations in input prices (e.g., raw materials, labor) will affect both MC and ATC, potentially shifting the intersection point.
Conclusion: A Crucial Relationship in Microeconomics
The intersection of the marginal cost (MC) curve and the average total cost (ATC) curve at the minimum point of the ATC is a cornerstone of microeconomic theory. Understanding this relationship is crucial for comprehending how firms make production decisions, minimize costs, and operate in different market structures. While the basic model provides a solid foundation, incorporating factors like economies and diseconomies of scale, technological change, and input price fluctuations provides a more nuanced and realistic picture of the dynamics between MC and ATC in real-world business environments. This knowledge empowers businesses to make informed decisions regarding pricing, production, and long-term strategy, ultimately leading to increased efficiency and profitability.
Latest Posts
Latest Posts
-
How Many Atoms Are In A Fcc Unit Cell
Mar 25, 2025
-
How Would You Differentiate Active Transport From Passive Transport
Mar 25, 2025
-
How Long Is 2 Weeks In Hours
Mar 25, 2025
Related Post
Thank you for visiting our website which covers about The Marginal Cost Curve Intersects The Average Total Cost Curve . We hope the information provided has been useful to you. Feel free to contact us if you have any questions or need further assistance. See you next time and don't miss to bookmark.
