Formula For Standard Deviation Of Grouped Data
News Leon
Mar 24, 2025 · 6 min read
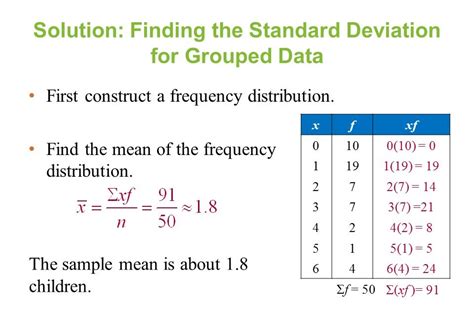
Table of Contents
The Formula for Standard Deviation of Grouped Data: A Comprehensive Guide
Understanding standard deviation is crucial in statistics for measuring the dispersion or spread of a dataset around its mean. While calculating the standard deviation for ungrouped data is relatively straightforward, dealing with grouped data requires a slightly different approach. This comprehensive guide will delve into the formula for calculating the standard deviation of grouped data, explaining each step clearly and providing examples to solidify your understanding.
Why Use Grouped Data?
Before jumping into the formula, let's understand why we use grouped data in the first place. Often, datasets are large and unwieldy, making individual data point analysis impractical. Grouping data into classes (intervals) simplifies the data, allowing for easier visualization and analysis. This is particularly useful when dealing with continuous variables or a large number of data points. However, this simplification comes at a slight cost—we lose some precision in our calculations.
Understanding the Formula: A Step-by-Step Breakdown
The formula for the standard deviation of grouped data is slightly more complex than its ungrouped counterpart. It involves several steps:
1. Calculating the midpoint of each class:
- The first step is to determine the midpoint (class mark) of each class interval. This is simply the average of the lower and upper class limits. For example, if a class is 10-20, the midpoint is (10+20)/2 = 15.
2. Calculating the mean (x̄) of the grouped data:
- The mean is calculated differently than for ungrouped data. We use the following formula:
x̄ = Σ(fᵢ * mᵢ) / Σfᵢ
Where:
x̄represents the mean of the grouped data.fᵢrepresents the frequency of each class.mᵢrepresents the midpoint of each class.Σrepresents the summation.
3. Calculating the deviation from the mean (mᵢ - x̄):
- Next, we determine the deviation of each class midpoint from the calculated mean. This involves subtracting the mean (x̄) from each midpoint (mᵢ).
4. Squaring the deviations [(mᵢ - x̄)²]:
- We then square each of the deviations to eliminate negative values and give greater weight to larger deviations.
5. Multiplying the squared deviations by their frequencies [fᵢ * (mᵢ - x̄)²]:
- To incorporate the frequency of each class, we multiply the squared deviation of each class by its corresponding frequency.
6. Summing the weighted squared deviations [Σfᵢ * (mᵢ - x̄)²]:
- We then sum all the weighted squared deviations to obtain a measure of the total squared deviation of the data from the mean.
7. Calculating the variance (σ²):
- The variance is calculated by dividing the sum of the weighted squared deviations by the total frequency (N):
σ² = Σfᵢ * (mᵢ - x̄)² / Σfᵢ (N)
8. Calculating the standard deviation (σ):
- Finally, the standard deviation is the square root of the variance:
σ = √[Σfᵢ * (mᵢ - x̄)² / Σfᵢ]
Illustrative Example: Calculating Standard Deviation of Grouped Data
Let's work through a practical example to make this clearer. Consider the following data representing the ages of participants in a workshop:
| Age Group (Years) | Frequency (fᵢ) |
|---|---|
| 20-25 | 5 |
| 26-31 | 10 |
| 32-37 | 15 |
| 38-43 | 8 |
| 44-49 | 2 |
Step 1: Calculate the midpoints (mᵢ):
| Age Group (Years) | Frequency (fᵢ) | Midpoint (mᵢ) |
|---|---|---|
| 20-25 | 5 | 22.5 |
| 26-31 | 10 | 28.5 |
| 32-37 | 15 | 34.5 |
| 38-43 | 8 | 40.5 |
| 44-49 | 2 | 46.5 |
Step 2: Calculate the mean (x̄):
- Σfᵢ = 5 + 10 + 15 + 8 + 2 = 40
- Σ(fᵢ * mᵢ) = (5 * 22.5) + (10 * 28.5) + (15 * 34.5) + (8 * 40.5) + (2 * 46.5) = 1365
- x̄ = 1365 / 40 = 34.125
Step 3-6: Calculate the weighted squared deviations:
| Age Group (Years) | fᵢ | mᵢ | (mᵢ - x̄) | (mᵢ - x̄)² | fᵢ * (mᵢ - x̄)² |
|---|---|---|---|---|---|
| 20-25 | 5 | 22.5 | -11.625 | 135.14 | 675.7 |
| 26-31 | 10 | 28.5 | -5.625 | 31.64 | 316.4 |
| 32-37 | 15 | 34.5 | 0.375 | 0.14 | 2.1 |
| 38-43 | 8 | 40.5 | 6.375 | 40.64 | 325.12 |
| 44-49 | 2 | 46.5 | 12.375 | 153.14 | 306.28 |
| Totals | 40 | 1625.6 |
Step 7: Calculate the variance (σ²):
- σ² = 1625.6 / 40 = 40.64
Step 8: Calculate the standard deviation (σ):
- σ = √40.64 ≈ 6.375
Therefore, the standard deviation of the grouped age data is approximately 6.375 years.
Interpreting the Standard Deviation
The standard deviation (6.375 in our example) tells us how spread out the ages are around the mean age (34.125). A larger standard deviation indicates greater variability or dispersion in the data. Conversely, a smaller standard deviation signifies that the data points are clustered more closely around the mean.
Limitations of Using Grouped Data
While grouped data simplifies analysis, it's essential to acknowledge its limitations. The process of grouping data inherently involves some loss of information. The precision of the standard deviation calculated from grouped data is lower than that calculated from ungrouped data. The choice between using grouped or ungrouped data depends on the specific context, the size of the dataset, and the desired level of precision.
Choosing the Right Approach: Grouped vs. Ungrouped Data
The decision of whether to use grouped or ungrouped data depends heavily on the nature of your dataset and your analytical goals.
Ungrouped Data:
- Best for: Smaller datasets where individual data points are readily available and precision is paramount.
- Advantages: Provides the most accurate standard deviation calculation.
- Disadvantages: Can be cumbersome and time-consuming for large datasets.
Grouped Data:
- Best for: Large datasets, continuous variables, or situations where a summary representation of the data is sufficient.
- Advantages: Simplifies data analysis, makes visualization easier, and is less computationally intensive for large datasets.
- Disadvantages: Sacrifices some precision in the standard deviation calculation.
Advanced Considerations: Impact of Class Intervals
The width of the class intervals can influence the calculated standard deviation. Narrower intervals provide a more precise estimate, but increase the computational effort. Wider intervals simplify the calculation but may lead to a less accurate reflection of the data's true dispersion. Choosing appropriate class intervals is a critical step in ensuring the validity of the results.
Conclusion: Mastering Standard Deviation for Grouped Data
Understanding the formula for the standard deviation of grouped data is a valuable skill for any statistician or data analyst. While it requires more steps than calculating the standard deviation for ungrouped data, the process is straightforward once you understand the underlying principles. Remember to carefully choose your class intervals and consider the trade-off between simplicity and precision. By mastering this technique, you can effectively analyze and interpret large and complex datasets, gaining valuable insights into the variability and distribution of your data. This knowledge empowers you to make better-informed decisions based on a robust understanding of statistical dispersion. The ability to interpret standard deviation effectively contributes significantly to accurate data analysis and informed conclusions across a variety of fields.
Latest Posts
Latest Posts
-
Correctly Label The Following Parts Of The Testis
Mar 26, 2025
-
Which Of The Following Equations Is True
Mar 26, 2025
-
The Molar Mass Of Cuso4 5h2o Is 249
Mar 26, 2025
-
Enzymes Belong To Which Group Of Macromolecules
Mar 26, 2025
-
A Word On A Web Page That When Clicked
Mar 26, 2025
Related Post
Thank you for visiting our website which covers about Formula For Standard Deviation Of Grouped Data . We hope the information provided has been useful to you. Feel free to contact us if you have any questions or need further assistance. See you next time and don't miss to bookmark.
