Example Of A Small Scale Map
News Leon
Mar 19, 2025 · 6 min read
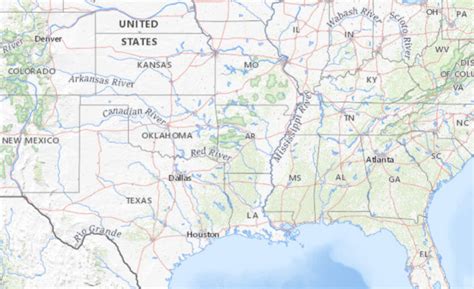
Table of Contents
Examples of Small-Scale Maps: A Deep Dive into Cartographic Representation
Small-scale maps, characterized by a small representative fraction (RF) – meaning a large area is depicted on a small map – play a crucial role in various fields, from navigation and geographic information systems (GIS) to urban planning and environmental studies. Understanding their characteristics, applications, and limitations is essential for effective map use and interpretation. This article delves into the diverse world of small-scale maps, providing numerous examples and exploring their significance in the modern world.
What Defines a Small-Scale Map?
Before exploring examples, let's establish what constitutes a small-scale map. The key is the representative fraction (RF), also known as the scale. This fraction indicates the ratio between the distance on the map and the corresponding distance on the ground. A small-scale map has a small RF, for example, 1:1,000,000 or even smaller. This means that one unit on the map represents one million units on the ground. Conversely, a large-scale map would have a larger RF, like 1:10,000, showing more detail within a smaller geographical area.
Key Differences from Large-Scale Maps:
- Area Coverage: Small-scale maps cover vast areas, encompassing entire countries, continents, or even the globe.
- Level of Detail: They show less detail than large-scale maps. Individual buildings, smaller roads, or minor geographical features are generally not depicted.
- Purpose: They are typically used for overview, regional analysis, and broad-scale planning, rather than precise location identification.
- Generalization: Significant generalization is necessary to represent vast areas on a small scale. This involves simplifying features and omitting less important details to maintain clarity and readability.
Examples of Small-Scale Map Applications and Types
The applications of small-scale maps are incredibly diverse. Here are some key examples, categorized for clarity:
1. World Maps and Atlases: The Epitome of Small-Scale Mapping
World maps are perhaps the most recognizable examples of small-scale cartography. They provide a global perspective, showing continents, oceans, major mountain ranges, and significant political boundaries. Atlases, collections of maps, often feature numerous small-scale maps, showcasing various aspects of the world, such as climate zones, population density, or economic activities. Consider a world map with a scale of 1:100,000,000 – it's capable of showing the entire planet, but individual cities will be mere dots.
Specific examples within this category might include:
- A Mercator projection world map: This projection, while distorting areas at higher latitudes, is commonly used for navigation due to its preservation of direction.
- A Robinson projection world map: This projection attempts to minimize distortions in both area and shape, providing a more balanced representation of the globe.
- Thematic world maps: These might showcase global temperature patterns, population distributions, or the spread of specific diseases.
2. National and Regional Maps: Providing a Country-Level Overview
National maps provide a comprehensive overview of a particular country. These maps often depict major cities, transportation networks (roads, railways, waterways), important geographical features (mountains, rivers, lakes), and political divisions (states, provinces). Regional maps focus on specific areas within a country, providing a more detailed view than national maps but still employing a relatively small scale.
Specific examples in this category could be:
- A map of the United States showing state boundaries and major highways. The scale would allow for the depiction of the entire country but would not show individual streets within cities.
- A map of Europe illustrating major rivers, mountain ranges, and political borders. The details would be generalized to fit the smaller scale.
- A thematic map illustrating population density across a particular nation. This map would utilize color gradients or other visual techniques to represent variations in population.
3. Navigational Charts: Guiding Safe Passage Across Vast Oceans
While often associated with large-scale detail for coastal navigation, nautical charts also utilize small scales for oceanic navigation. These charts showcase ocean currents, depths, and significant landmarks. They are crucial for long-distance voyages, providing essential information for safe and efficient passage.
Specific examples:
- A Gnomonic projection chart for long-distance air or sea navigation. This projection is useful for plotting great-circle routes.
- A Mercator projection chart used for ocean navigation. This projection is useful for maintaining accurate compass bearings.
- A chart depicting ocean currents and wind patterns.
4. Thematic Maps: Visualizing Spatial Data
Thematic maps, also known as choropleth maps, use color or shading to represent data values across different geographical areas. Small-scale thematic maps can visualize data across large regions, providing insights into patterns and trends.
Examples of thematic small-scale maps:
- A map showing global carbon emissions by country. This would use color shading to illustrate variations in emission levels.
- A map depicting global distribution of languages. The map would use different colors to represent different language families.
- A map showcasing global deforestation rates. This map would use different shades to represent levels of deforestation.
5. Planning and Environmental Studies: Assessing Large Areas for Development and Conservation
Small-scale maps are indispensable tools in urban planning and environmental studies. They provide a broad perspective, enabling planners and researchers to assess large areas for development projects, assess environmental impact, or monitor changes over time.
Examples within this field include:
- A map showcasing land use patterns in a large metropolitan area. This map might show the distribution of residential, commercial, and industrial areas.
- A map depicting potential areas suitable for renewable energy projects (solar, wind). This map would consider various factors such as terrain, wind speeds, and sunlight exposure.
- A map showing areas affected by natural disasters like wildfires or floods. This map would help in assessing the extent of damage and directing relief efforts.
Limitations of Small-Scale Maps
While small-scale maps offer a broad perspective, they have limitations:
- Limited Detail: The primary drawback is the lack of detail. Individual features are generalized or omitted entirely, potentially leading to misinterpretations.
- Distortions: Map projections inherently introduce distortions, particularly in area and shape, especially in small-scale maps covering large areas.
- Generalizations: Simplifications, while necessary, can mask important local variations or complexities.
- Inaccuracy: The level of accuracy is inherently lower compared to large-scale maps.
Conclusion: The Importance of Understanding Scale
Small-scale maps provide valuable insights into the world, offering a broad perspective on geographical phenomena and spatial data. From understanding global climate patterns to planning large-scale infrastructure projects, these maps play a crucial role in many disciplines. However, understanding their limitations, including the impact of scale and generalization, is critical for accurate interpretation and responsible use. By appreciating the interplay between scale, detail, and accuracy, users can effectively harness the power of small-scale maps in a variety of contexts. Remember to always consider the purpose and limitations of the specific map being used to avoid misinterpretations and ensure informed decision-making.
Latest Posts
Latest Posts
-
The Central Part Of The Atom Is Called The
Mar 20, 2025
-
The Figure Shows A Conical Pendulum In Which The Bob
Mar 20, 2025
-
What Is The Heart Of A Computer
Mar 20, 2025
-
Which Statement Is Not Always True For A Parallelogram
Mar 20, 2025
-
What Percent Of 40 Is 16
Mar 20, 2025
Related Post
Thank you for visiting our website which covers about Example Of A Small Scale Map . We hope the information provided has been useful to you. Feel free to contact us if you have any questions or need further assistance. See you next time and don't miss to bookmark.
