Energy Level Diagram For The Hydrogen Atom
News Leon
Mar 16, 2025 · 7 min read
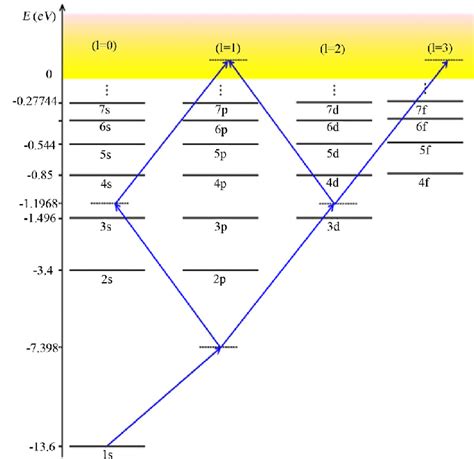
Table of Contents
Energy Level Diagram for the Hydrogen Atom: A Comprehensive Guide
The hydrogen atom, with its single proton and electron, serves as the cornerstone of atomic physics. Understanding its structure and behavior is crucial for comprehending more complex atoms and molecules. A key tool in this understanding is the energy level diagram for the hydrogen atom, a visual representation of the possible energy states an electron can occupy. This diagram provides invaluable insights into atomic transitions, spectral lines, and the quantum nature of matter. This comprehensive guide will delve into the intricacies of the hydrogen atom's energy level diagram, exploring its construction, interpretation, and implications.
The Bohr Model and its Limitations
Before diving into the intricacies of the energy level diagram, it's important to acknowledge the historical context. Niels Bohr's model of the atom, though ultimately superseded by quantum mechanics, provided a crucial stepping stone. Bohr proposed that electrons orbit the nucleus in specific, quantized energy levels. This model successfully explained the observed spectral lines of hydrogen, associating each line with a transition between these energy levels.
However, the Bohr model has significant limitations. It fails to accurately predict the spectra of atoms with more than one electron and doesn't account for phenomena like electron spin or the fine structure of spectral lines. Despite its shortcomings, the Bohr model's conceptual simplicity provides a useful introduction to the idea of quantized energy levels.
The Quantum Mechanical Picture: Schrödinger Equation and Atomic Orbitals
The accurate description of the hydrogen atom comes from quantum mechanics, specifically the solution of the time-independent Schrödinger equation for the atom. This equation, a fundamental equation in quantum mechanics, describes the electron's wavefunction, which contains all information about the electron's state. Solving this equation for the hydrogen atom yields a set of wavefunctions, each corresponding to a specific energy level and a specific orbital shape.
These orbitals are characterized by three quantum numbers:
-
Principal Quantum Number (n): This integer (n = 1, 2, 3, ...) determines the energy level and the size of the orbital. Higher values of n correspond to higher energy levels and larger orbitals.
-
Azimuthal Quantum Number (l): This integer (l = 0, 1, 2, ..., n-1) determines the orbital's shape and angular momentum. l = 0 corresponds to an s orbital (spherical), l = 1 to a p orbital (dumbbell-shaped), l = 2 to a d orbital, and so on.
-
Magnetic Quantum Number (ml): This integer (ml = -l, -l+1, ..., 0, ..., l-1, l) determines the orbital's orientation in space. For a given value of l, there are 2l+1 possible orientations.
Constructing the Energy Level Diagram
The energy level diagram for hydrogen visually represents the quantized energy levels predicted by solving the Schrödinger equation. It typically depicts the energy levels as horizontal lines, with the energy increasing upwards. Each line represents a specific energy level, corresponding to a particular value of the principal quantum number, n.
Key features of the hydrogen energy level diagram:
-
Discrete Energy Levels: The lines are discrete and separated, illustrating the quantized nature of energy. Electrons can only exist in these specific energy levels.
-
Energy Level Convergence: As n increases, the energy levels become closer together, eventually converging at an energy of 0 (ionization energy). This means it requires less and less energy to excite an electron to higher energy levels as n gets larger.
-
Degeneracy: For a given value of n, multiple orbitals with different values of l and ml have the same energy. This is called degeneracy, and it's a characteristic of the hydrogen atom (but not of multi-electron atoms). This degeneracy is lifted in the presence of external fields, such as magnetic fields, leading to the Zeeman effect.
-
Ground State: The lowest energy level (n=1) is called the ground state. In the ground state, the electron is closest to the nucleus and has the lowest energy.
-
Excited States: Energy levels with n > 1 are called excited states. Electrons in excited states have higher energy than those in the ground state.
Interpreting the Energy Level Diagram
The hydrogen atom's energy level diagram is not just a static picture; it’s a dynamic representation of electron transitions. The diagram allows us to predict the wavelengths of light emitted or absorbed by the atom during these transitions.
-
Absorption: When an electron absorbs a photon of light with energy equal to the energy difference between two levels, it jumps to a higher energy level. The energy of the photon must precisely match the energy difference between the levels.
-
Emission: When an electron in an excited state falls back to a lower energy level, it emits a photon of light with energy equal to the energy difference between the two levels. This emission gives rise to the characteristic spectral lines of hydrogen.
The energy difference (ΔE) between two levels is related to the frequency (ν) and wavelength (λ) of the emitted or absorbed photon by the following equation:
ΔE = hν = hc/λ
where:
- h is Planck's constant
- c is the speed of light
The Balmer Series and Other Spectral Series
The energy level diagram elegantly explains the different spectral series observed in the hydrogen spectrum. For example, the Balmer series, visible to the naked eye, corresponds to transitions where the electron falls to the n=2 energy level from higher energy levels. Other series, such as the Lyman series (transitions to n=1), Paschen series (transitions to n=3), and Brackett series (transitions to n=4), correspond to transitions to different final energy levels. Each series has its own characteristic wavelengths and is located in different regions of the electromagnetic spectrum.
Fine Structure and Hyperfine Structure
The simple energy level diagram discussed above represents an idealized hydrogen atom. More refined models incorporate the effects of:
-
Fine Structure: This refers to small energy differences within a given energy level caused by relativistic effects and the spin-orbit interaction (the interaction between the electron's spin and its orbital angular momentum). These effects split the energy levels into closely spaced sublevels.
-
Hyperfine Structure: This results from the interaction between the electron's spin and the proton's spin, leading to an even finer splitting of the energy levels.
Beyond Hydrogen: Multi-Electron Atoms
While the hydrogen atom provides a fundamental framework, the energy level diagrams of multi-electron atoms are significantly more complex. Electron-electron interactions, lacking in the hydrogen atom, lead to a loss of degeneracy and a more intricate arrangement of energy levels. These interactions make solving the Schrödinger equation analytically impossible for multi-electron atoms, requiring approximation methods. However, the fundamental principles of quantized energy levels and electron transitions still apply.
Applications of the Hydrogen Atom's Energy Level Diagram
The energy level diagram of the hydrogen atom has far-reaching implications beyond its fundamental importance in atomic physics. Its understanding is critical in:
-
Spectroscopy: Analyzing the emission and absorption spectra of atoms and molecules helps identify their composition and structure. The hydrogen atom serves as a benchmark for interpreting more complex spectra.
-
Astrophysics: The hydrogen atom's spectral lines are crucial in studying stars and interstellar gas clouds. Observing these lines allows astronomers to determine the temperature, density, and motion of these celestial objects.
-
Laser Technology: The precise energy levels in the hydrogen atom are exploited in the development of hydrogen lasers, which have applications in various scientific and technological fields.
Conclusion
The energy level diagram for the hydrogen atom is a powerful visual tool that encapsulates the quantum nature of matter and atomic structure. Its simplicity, yet profound implications, make it a cornerstone of atomic physics and a crucial stepping stone towards understanding more complex atoms and molecules. By understanding this diagram, we gain insights into atomic transitions, spectral lines, and the behavior of matter at the atomic level, leading to advancements in diverse fields, ranging from astrophysics to laser technology. The simplicity of the hydrogen atom allows for precise theoretical calculations and experimental verification, solidifying its status as a fundamental model in modern physics.
Latest Posts
Latest Posts
-
Which Best Describes Mitochondrial Dna Mtdna
Mar 16, 2025
-
What Is The Largest Lymphoid Organ
Mar 16, 2025
-
What Is A Non Permanent Magnet
Mar 16, 2025
-
3 Cards Same From 52 Probability
Mar 16, 2025
-
Which Cell Organelle Is Found Only In Plant Cell
Mar 16, 2025
Related Post
Thank you for visiting our website which covers about Energy Level Diagram For The Hydrogen Atom . We hope the information provided has been useful to you. Feel free to contact us if you have any questions or need further assistance. See you next time and don't miss to bookmark.
