Ecg Is A Graphic Recording Of
News Leon
Mar 26, 2025 · 7 min read
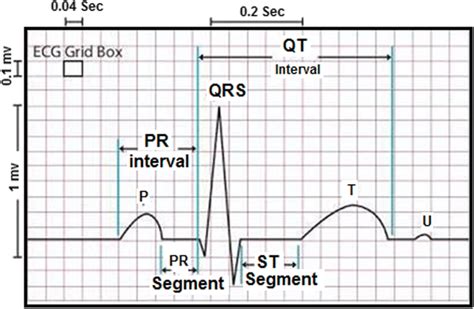
Table of Contents
ECG is a Graphic Recording of the Heart's Electrical Activity: A Comprehensive Guide
An electrocardiogram (ECG or EKG) is a graphic recording of the electrical activity of the heart over a period of time, as detected by electrodes placed on the surface of the skin and recorded by a machine called an electrocardiograph. It's a cornerstone diagnostic tool in cardiology, providing invaluable information about the heart's rhythm, rate, and overall electrical conduction system. Understanding what an ECG represents is crucial for interpreting its findings and appreciating its significance in diagnosing various cardiac conditions.
Understanding the Heart's Electrical System
Before delving into the specifics of ECG recordings, it's essential to grasp the underlying principles of the heart's electrical conduction system. This intricate network of specialized cells generates and transmits electrical impulses, coordinating the rhythmic contraction of the heart's chambers. The process starts in the sinoatrial (SA) node, often called the heart's natural pacemaker, located in the right atrium. The SA node spontaneously generates electrical impulses at a regular rate, initiating the heartbeat.
The Pathway of Electrical Impulses:
- SA Node: The electrical impulse originates here.
- Atrioventricular (AV) Node: The impulse travels to the AV node, a crucial relay station between the atria and ventricles. This slight delay allows the atria to fully contract and empty their blood into the ventricles before ventricular contraction begins.
- Bundle of His: From the AV node, the impulse passes through the Bundle of His, a specialized conducting pathway.
- Bundle Branches: The Bundle of His divides into left and right bundle branches, conducting the impulse down the interventricular septum to the apex of the heart.
- Purkinje Fibers: The impulse spreads rapidly throughout the ventricles via the Purkinje fibers, triggering ventricular contraction.
This coordinated electrical activity ensures that the atria contract first, followed by the ventricles, efficiently pumping blood throughout the body. Any disruption in this finely tuned system can lead to abnormal heart rhythms (arrhythmias) or impaired heart function. This is where the ECG proves invaluable.
What an ECG Shows: Waves, Segments, and Intervals
The ECG tracing is a visual representation of the heart's electrical activity. It's characterized by several distinct waves, segments, and intervals, each corresponding to a specific electrical event within the cardiac cycle.
Key Components of an ECG Tracing:
- P wave: Represents atrial depolarization—the electrical activation of the atria, leading to their contraction. It's typically upright and rounded.
- PR interval: The time interval between the onset of atrial depolarization (P wave) and the onset of ventricular depolarization (QRS complex). It reflects the time taken for the impulse to travel from the SA node through the atria, AV node, and His-Purkinje system.
- QRS complex: Represents ventricular depolarization—the electrical activation of the ventricles, causing ventricular contraction. It's typically composed of three deflections: a downward Q wave, an upward R wave, and a downward S wave. The QRS complex is usually short and narrow.
- ST segment: The isoelectric (flat) segment following the QRS complex. It represents the early phase of ventricular repolarization (the electrical recovery of the ventricles). Changes in the ST segment are important indicators of myocardial ischemia (reduced blood flow to the heart muscle) or injury.
- T wave: Represents ventricular repolarization—the electrical recovery of the ventricles. It's usually upright but can be inverted in certain conditions.
- QT interval: The time from the beginning of ventricular depolarization (QRS complex) to the end of ventricular repolarization (T wave). It reflects the total duration of ventricular electrical activity. Prolonged QT intervals can increase the risk of potentially fatal arrhythmias (Torsades de Pointes).
- U wave: A small, often indistinct wave following the T wave. Its exact origin is still debated, but it's believed to be associated with repolarization of the Purkinje fibers.
Analyzing these components allows clinicians to assess:
- Heart rate: Determined by measuring the time interval between consecutive R waves.
- Heart rhythm: Regularity or irregularity of the heartbeats.
- Presence of arrhythmias: Abnormal heart rhythms, such as atrial fibrillation, ventricular tachycardia, or bradycardia.
- Myocardial ischemia or injury: Changes in the ST segment and T wave can indicate these conditions.
- Electrolyte imbalances: Certain electrolyte disturbances, such as hyperkalemia or hypokalemia, can affect the ECG tracing.
- Conduction delays or blocks: Delays or obstructions in the heart's conduction pathway.
- Hypertrophy: Enlargement of the heart chambers.
Different ECG Leads and Their Significance
An ECG typically uses 12 leads, each providing a different perspective of the heart's electrical activity. These leads are arranged to view the heart from various angles, offering a comprehensive assessment. The leads are categorized into:
- Limb Leads (I, II, III, aVR, aVL, aVF): These leads provide views of the heart from different planes in the frontal plane.
- Chest Leads (V1-V6): These leads provide views of the heart from various points on the chest wall, primarily focusing on the horizontal plane.
Each lead records the electrical potential difference between two points on the body. The combination of these leads allows for a three-dimensional representation of the heart's electrical activity. Analyzing the waveforms in different leads helps pinpoint the location of any abnormalities, such as areas of ischemia, infarction (heart attack), or conduction disturbances.
Interpreting ECGs: A Complex Skill
Interpreting ECGs is a complex skill requiring extensive training and experience. While this guide provides a foundational understanding, it's crucial to emphasize that self-interpretation of ECGs should be avoided. ECG interpretation requires careful analysis of all the components, considering the patient's clinical presentation and medical history.
Misinterpreting an ECG can have serious consequences, leading to delayed or inappropriate treatment. Therefore, ECG interpretation should always be performed by trained healthcare professionals, such as cardiologists, electrophysiologists, or experienced nurses and paramedics.
Applications of ECGs in Clinical Practice
ECGs are widely used in various clinical settings for:
- Diagnosing arrhythmias: Detecting abnormal heart rhythms, such as atrial fibrillation, atrial flutter, ventricular tachycardia, and bradycardia.
- Detecting myocardial ischemia or infarction: Identifying reduced blood flow or damage to the heart muscle.
- Monitoring the effects of medications: Assessing the impact of heart medications on heart rhythm and function.
- Preoperative assessment: Evaluating heart health before surgical procedures.
- Assessing electrolyte imbalances: Identifying abnormalities in blood potassium, sodium, or other electrolytes.
- Monitoring patients during and after cardiac procedures: Tracking heart rhythm and function during and after procedures like angioplasty or surgery.
- Detecting cardiomyopathies: Evaluating heart muscle diseases.
- Evaluating conduction abnormalities: Detecting blocks or delays in the heart's electrical conduction system.
The ECG plays a crucial role in guiding appropriate medical management, including medication, lifestyle changes, and potentially life-saving interventions like cardioversion or pacemaker implantation.
Advances in ECG Technology
Technological advancements continue to enhance ECG capabilities. For instance, portable ECG devices allow for continuous monitoring outside the hospital setting, providing valuable data for remote patient monitoring and early detection of potentially life-threatening events. Holter monitors record ECG data over 24 hours or longer, capturing intermittent arrhythmias that may not be apparent during a routine ECG. Event recorders are triggered by the patient when they experience symptoms, providing a recording of the electrical activity at the time of the event. Implantable loop recorders provide long-term ECG monitoring, even years, ideal for patients with recurrent unexplained syncope or palpitations. Further advancements include algorithms that provide automated ECG analysis, facilitating faster diagnosis and improving efficiency.
Conclusion: The ECG – A Vital Tool in Cardiology
The electrocardiogram is a powerful and indispensable tool in the diagnosis and management of various cardiac conditions. Its ability to provide a detailed visual representation of the heart's electrical activity allows clinicians to assess rhythm, rate, conduction, and myocardial health. While ECG interpretation requires specialized knowledge and skill, understanding the basic principles of ECG waveforms, segments, and intervals provides valuable insight into the heart's electrical function and the critical role of this diagnostic test in cardiovascular care. The ongoing technological advancements in ECG technology promise to further refine diagnostic capabilities and enhance patient care. Always remember that self-interpretation should be avoided and that a proper medical consultation is essential for diagnosis and treatment.
Latest Posts
Latest Posts
-
A Long Nonconducting Solid Cylinder Of Radius
Mar 29, 2025
-
What Will Happen If Ribosomes Are Removed From The Cell
Mar 29, 2025
-
How Many Hydrogen Bonds Between C And G
Mar 29, 2025
-
Regulates What Enters And Leaves The Cell
Mar 29, 2025
-
The Most Active Phagocytic Cells In Circulating Blood Are
Mar 29, 2025
Related Post
Thank you for visiting our website which covers about Ecg Is A Graphic Recording Of . We hope the information provided has been useful to you. Feel free to contact us if you have any questions or need further assistance. See you next time and don't miss to bookmark.
