Why Demand Curve Is Downward Sloping
News Leon
Mar 23, 2025 · 7 min read
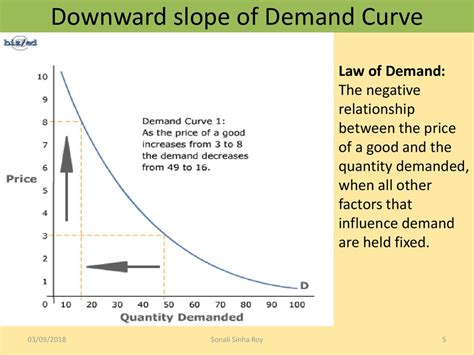
Table of Contents
Why is the Demand Curve Downward Sloping? A Comprehensive Exploration
The fundamental principle of economics, the downward-sloping demand curve, is a cornerstone of microeconomic theory. It visually represents the inverse relationship between the price of a good or service and the quantity demanded by consumers. Understanding why this curve slopes downwards is crucial for grasping many economic concepts, from market equilibrium to government policy. This in-depth exploration will delve into the various factors that contribute to this ubiquitous economic phenomenon.
The Law of Demand: A Foundation
The downward slope of the demand curve is a direct manifestation of the law of demand. This law states that, ceteris paribus (all other things being equal), as the price of a good decreases, the quantity demanded of that good increases, and vice versa. This inverse relationship isn't merely an observation; it's rooted in several powerful economic forces.
1. The Substitution Effect: Finding Cheaper Alternatives
When the price of a good falls, it becomes relatively cheaper compared to its substitutes. This is the substitution effect. Consumers are incentivized to substitute the now-cheaper good for its more expensive alternatives. For example, if the price of beef decreases, consumers might switch from purchasing chicken or pork to beef, increasing the quantity demanded of beef. The opposite holds true; if the price of beef rises, consumers might substitute it with chicken or pork, decreasing the quantity demanded of beef.
Example: The price of coffee drops. Consumers who previously drank tea might switch to coffee, leading to an increase in coffee consumption.
2. The Income Effect: Increased Purchasing Power
A decrease in the price of a good effectively increases consumers' purchasing power. This is the income effect. With the same amount of money, consumers can now afford to buy more of the good at the lower price. This increase in purchasing power allows consumers to buy more of the good, not just as a substitute but also as an increase in overall consumption.
Example: The price of gasoline decreases. Consumers now have more disposable income available for other goods and services, potentially increasing their spending on those items and increasing the demand for gasoline.
3. The Diminishing Marginal Utility: The Law of Decreasing Satisfaction
The law of diminishing marginal utility states that as a consumer consumes more of a good, the additional satisfaction (utility) derived from each additional unit decreases. This means that the first unit of a good provides the highest level of satisfaction, the second unit provides less, and so on. Consumers will only purchase additional units if the price falls enough to compensate for the reduced satisfaction.
Example: Imagine eating pizza slices. The first slice is incredibly satisfying, the second is still good, but by the fifth or sixth slice, the satisfaction diminishes considerably. You would only eat more slices if the price per slice is significantly lower.
Beyond the Basic Principles: Other Factors Influencing Demand
While the substitution, income, and diminishing marginal utility effects are central to the downward-sloping demand curve, several other factors can also influence the quantity demanded at a given price. These factors, often encapsulated by the ceteris paribus clause, are critical to a complete understanding.
1. Consumer Preferences and Tastes: Fashion and Trends
Changes in consumer preferences and tastes can shift the entire demand curve, not just move along it. If a particular good becomes more fashionable or desirable, the demand curve will shift to the right (increased demand at every price). Conversely, if a good falls out of favor, the demand curve will shift to the left (decreased demand at every price).
Example: The popularity of a particular brand of athletic shoes increases, leading to a higher demand at all price points.
2. Consumer Expectations: Anticipating Future Prices
Consumers' expectations about future prices significantly influence current demand. If consumers anticipate a future price increase, they may purchase more of the good now, shifting the demand curve to the right. Conversely, if they anticipate a future price decrease, they may delay their purchases, shifting the demand curve to the left.
Example: Consumers anticipate a rise in the price of gasoline; they purchase more gasoline now, even at the current price.
3. Income Levels: Disposable Income and Purchasing Power
Changes in overall income levels within an economy impact the demand for goods and services. An increase in income generally leads to an increase in demand for most goods (normal goods), shifting the demand curve to the right. However, for inferior goods (goods whose demand decreases as income increases), an income increase would shift the demand curve to the left.
Example: A rise in average household income leads to increased demand for luxury cars, but decreased demand for generic brands of pasta.
4. Prices of Related Goods: Complements and Substitutes
The prices of related goods—complements and substitutes—influence the demand for a specific good. A decrease in the price of a complement (a good consumed jointly with another) will increase the demand for the original good, shifting the demand curve to the right. Conversely, a decrease in the price of a substitute will decrease the demand for the original good, shifting the demand curve to the left.
Example: A decrease in the price of printers increases the demand for printer ink (complement). A decrease in the price of tablets decreases the demand for laptops (substitute).
5. Number of Buyers: Market Size and Population
The size of the market—the number of buyers—directly influences the overall demand. An increase in the number of buyers will shift the demand curve to the right, while a decrease will shift it to the left. This is especially relevant in growing populations or expanding market areas.
Example: An increase in population in a city leads to a higher overall demand for housing in that city.
6. Consumer Confidence and Expectations: Economic Outlook
Broader economic conditions and consumer confidence play a substantial role. During periods of economic uncertainty or low consumer confidence, demand for non-essential goods often decreases, shifting the demand curve to the left. Conversely, during periods of economic prosperity and high confidence, demand increases, shifting the demand curve to the right.
Example: During a recession, consumers are likely to reduce their spending on luxury items, reducing the demand for those items.
Exceptions and Considerations: When the Demand Curve Might Not Slope Downward
While the downward-sloping demand curve is the norm, there are some exceptions and nuances to consider:
-
Giffen Goods: These are rare exceptions where an increase in price leads to an increase in quantity demanded. This occurs when the income effect of a price increase outweighs the substitution effect, typically for inferior goods that make up a significant portion of a consumer's budget (e.g., staple foods in extremely impoverished situations).
-
Veblen Goods: These are luxury goods where demand increases with price because of their status symbol appeal. The higher the price, the more desirable they become, defying the typical downward-sloping demand curve.
Conclusion: The Dynamic Nature of Demand
The downward-sloping demand curve is not a rigid, immutable law but a powerful representation of the typical relationship between price and quantity demanded. It's a dynamic relationship, influenced by a complex interplay of factors that continually shift and adjust. Understanding these underlying forces, including the substitution effect, the income effect, diminishing marginal utility, and the various external factors, is essential for comprehending market behavior, predicting consumer responses, and formulating effective economic policies. By acknowledging the exceptions and understanding the nuances, we can gain a far more robust and nuanced understanding of the intricacies of market demand. The ongoing interplay between these factors ensures the constant evolution and adaptation of the demand curve, making it a fascinating and crucial concept in the field of economics.
Latest Posts
Latest Posts
-
The Ability To Respond To A Stimulus
Mar 25, 2025
-
What Is The Area Of Triangle Lmn
Mar 25, 2025
-
The Figure Shows A Circular Region Of Radius R
Mar 25, 2025
-
30 Is 60 Percent Of What Number
Mar 25, 2025
-
What Is The Percent Of 0 04
Mar 25, 2025
Related Post
Thank you for visiting our website which covers about Why Demand Curve Is Downward Sloping . We hope the information provided has been useful to you. Feel free to contact us if you have any questions or need further assistance. See you next time and don't miss to bookmark.
