Which Of The Following Represents A Quadratic Function
News Leon
Mar 26, 2025 · 6 min read
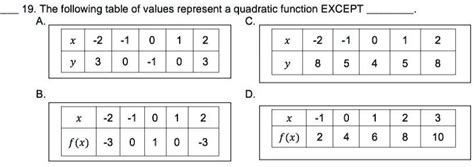
Table of Contents
Which of the Following Represents a Quadratic Function? A Deep Dive
Determining whether a given function is quadratic requires a solid understanding of quadratic functions' defining characteristics. This article provides a comprehensive exploration of quadratic functions, clarifying their properties and offering various methods to identify them, particularly focusing on distinguishing them from other function types. We'll delve into examples, explore different representations (equations, graphs, tables), and address common misconceptions. By the end, you'll be confident in identifying quadratic functions in diverse contexts.
Understanding Quadratic Functions: The Fundamentals
A quadratic function is a polynomial function of degree two. This means the highest power of the variable (typically x) is 2. The general form of a quadratic function is:
f(x) = ax² + bx + c
where a, b, and c are constants, and a is not equal to zero (a ≠ 0). If a were zero, the x² term would vanish, leaving a linear function. The coefficient a significantly influences the parabola's shape (opens upwards if a > 0, downwards if a < 0) and its vertical stretch or compression. The coefficient b affects the parabola's horizontal position (shifting the vertex), and c represents the y-intercept (the point where the parabola crosses the y-axis).
Key Characteristics of Quadratic Functions:
- Parabola: The graph of a quadratic function is always a parabola, a U-shaped curve. This is a unique and defining feature.
- Vertex: The parabola has a single vertex, which is either the minimum or maximum point of the function, depending on the sign of a.
- Axis of Symmetry: The parabola is symmetric about a vertical line called the axis of symmetry, which passes through the vertex.
- Roots/Zeros/x-intercepts: The parabola may intersect the x-axis at zero, one, or two points. These points are the roots, zeros, or x-intercepts of the function. They represent the values of x for which f(x) = 0.
- Second Differences: In a table of values, the second differences between consecutive y-values are constant for a quadratic function. This is a useful tool for identifying quadratics from tabular data.
Identifying Quadratic Functions: Different Representations
Let's examine how to identify quadratic functions when presented in various forms:
1. Identifying Quadratic Functions from Equations
The most straightforward way to identify a quadratic function is by examining its equation. Look for the following:
- Highest power of x is 2: The term with the highest power of x must be x².
- No higher powers of x: There should be no terms with x³, x⁴, or any higher powers of x.
- 'a' cannot be zero: The coefficient of the x² term (a) must be non-zero.
Examples:
- f(x) = 2x² + 5x - 3: This is a quadratic function because the highest power of x is 2, and the coefficient of x² (a=2) is not zero.
- g(x) = x - 7: This is a linear function, not a quadratic, because the highest power of x is 1.
- h(x) = 4x²: This is a quadratic function; it's a simplified form where b and c are zero.
- i(x) = 3x³ + 2x² + x + 1: This is a cubic function, not a quadratic, because the highest power of x is 3.
2. Identifying Quadratic Functions from Graphs
If you're given a graph, look for the characteristic parabola shape:
- U-shaped curve: The graph must be a symmetrical U-shaped curve, either opening upwards or downwards.
- Single vertex: Identify the vertex—the lowest or highest point on the curve.
- Axis of symmetry: Observe the vertical line about which the parabola is symmetrical.
Be cautious! Some graphs might appear parabolic but might be slightly distorted due to scaling or limited data points. Always consider the context and any accompanying information.
3. Identifying Quadratic Functions from Tables of Values
Analyzing tables of values offers another method for identifying quadratic functions. Focus on the second differences:
- Calculate the first differences: Subtract consecutive y-values.
- Calculate the second differences: Subtract consecutive first differences.
- Check for a constant second difference: If the second differences are constant, the function is likely quadratic.
Example Table:
| x | 0 | 1 | 2 | 3 | 4 |
|---|---|---|---|---|---|
| y | 1 | 4 | 9 | 16 | 25 |
| 1st diff | 3 | 5 | 7 | 9 | |
| 2nd diff | 2 | 2 | 2 | 2 |
In this example, the second differences are constant (2), strongly suggesting a quadratic function (y = x² + 1). However, note that a large enough data set is needed for accurate determination; a small sample may exhibit seemingly constant second differences even for non-quadratic functions.
Common Misconceptions and Pitfalls
Several common misunderstandings can lead to misidentification of quadratic functions:
- Confusing with other functions: Quadratics can sometimes visually resemble other functions, particularly when viewed with limited data or resolution. Close examination of the equation, graph, or table of values is crucial.
- Ignoring the coefficient 'a': Remember that a ≠ 0 is essential for a function to be considered quadratic. A function like f(x) = bx + c is linear, not quadratic, even though it has the appearance of a part of a quadratic function.
- Misinterpreting tabular data: Small datasets might show seemingly constant second differences, leading to inaccurate conclusions. A larger dataset and appropriate analysis are essential.
Advanced Techniques and Applications
While the methods mentioned above provide a strong foundation, more advanced techniques exist:
- Completing the square: This algebraic manipulation transforms the quadratic equation into vertex form (f(x) = a(x-h)² + k), revealing the vertex (h,k) and axis of symmetry (x = h).
- The quadratic formula: This formula solves for the roots (x-intercepts) of the quadratic equation: x = (-b ± √(b² - 4ac)) / 2a. The discriminant (b² - 4ac) helps determine the number of real roots.
- Calculus: Using derivatives, we can find the vertex (where the derivative is zero) and analyze concavity (second derivative).
Real-World Applications of Quadratic Functions
Quadratic functions are far from theoretical; they find widespread application in various fields:
- Physics: Modeling projectile motion (e.g., the trajectory of a ball), calculating the area of a parabolic reflector in a telescope, or describing simple harmonic motion.
- Engineering: Designing parabolic arches in bridges, calculating optimal shapes for structures, analyzing signal processing in electronics.
- Economics: Describing cost, revenue, and profit functions, modeling supply and demand curves (under certain assumptions).
- Computer graphics: Creating curved shapes and animations.
- Data analysis: Fitting quadratic models to datasets for predictive purposes.
Understanding quadratic functions is essential for anyone working in quantitative fields. Mastering their identification, analysis, and application opens doors to problem-solving in numerous domains. The key to successful identification lies in rigorously checking the defining properties—the parabolic graph, the presence of the x² term in the equation, and the constant second difference in tables of values. By employing these techniques and understanding the nuances, you can confidently determine which functions represent true quadratic relationships.
Latest Posts
Latest Posts
-
The Function Of Trna Is To
Mar 28, 2025
-
Which Components Are Necessary For Photosynthesis To Occur
Mar 28, 2025
-
What Is The Primary Excretory Route For Water Soluble Vitamins
Mar 28, 2025
-
Formula Standard Deviation For Grouped Data
Mar 28, 2025
-
Give The Product Of The Following Reaction
Mar 28, 2025
Related Post
Thank you for visiting our website which covers about Which Of The Following Represents A Quadratic Function . We hope the information provided has been useful to you. Feel free to contact us if you have any questions or need further assistance. See you next time and don't miss to bookmark.
