What Does The Slope Of A Distance Time Graph Represent
News Leon
Mar 26, 2025 · 6 min read
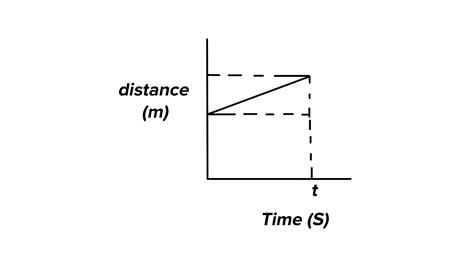
Table of Contents
What Does the Slope of a Distance-Time Graph Represent?
Understanding the slope of a distance-time graph is fundamental to grasping the concept of speed and its variations. This seemingly simple concept unlocks a deeper understanding of motion, providing a powerful visual tool to analyze and interpret movement. This comprehensive guide will delve into the intricacies of distance-time graphs, explaining not only what the slope represents but also how to interpret different slopes, handle scenarios with non-linear graphs, and apply this knowledge to real-world situations.
The Fundamentals: Distance, Time, and Speed
Before diving into the analysis of slopes, let's establish a firm foundation in the core concepts:
-
Distance: This refers to the total ground covered by an object during its motion. It's a scalar quantity, meaning it only has magnitude (size) and no direction. Units commonly used include meters (m), kilometers (km), miles (mi), etc.
-
Time: This represents the duration of the motion. It's also a scalar quantity, measured in seconds (s), minutes (min), hours (hr), etc.
-
Speed: Speed is a measure of how quickly an object covers distance over a period of time. It's calculated as distance divided by time (Speed = Distance/Time). Speed is a scalar quantity, and its units are typically meters per second (m/s), kilometers per hour (km/h), or miles per hour (mph).
The Distance-Time Graph: A Visual Representation of Motion
A distance-time graph is a powerful visual tool that plots distance on the vertical (y) axis and time on the horizontal (x) axis. Each point on the graph represents the object's distance at a specific time. The graph provides a visual representation of an object's motion, allowing for easy analysis of its speed and changes in speed over time.
The Slope: The Key to Understanding Speed
The slope of a distance-time graph represents the speed of the object. This is a crucial takeaway. A steeper slope indicates a higher speed, while a gentler slope indicates a lower speed. Let's break down why:
The slope is calculated using the formula:
Slope = (Change in Distance) / (Change in Time)
Notice the striking similarity to the formula for speed? This isn't a coincidence. The slope is, in essence, the average speed of the object over the interval of time being considered.
Interpreting Different Slopes:
-
Positive Slope: A positive slope indicates that the object is moving away from the starting point. The steeper the positive slope, the faster the object is moving.
-
Zero Slope (Horizontal Line): A horizontal line (zero slope) signifies that the object is stationary; it's not moving, and its distance remains constant over time.
-
Negative Slope: A negative slope indicates that the object is moving towards its starting point. The steeper the negative slope, the faster it is returning. It's important to note that while the slope is negative, the speed is still positive (speed is a scalar, not a vector).
Analyzing Different Types of Motion on Distance-Time Graphs
Real-world motion is rarely perfectly constant. Let's explore how different types of motion are represented on a distance-time graph:
1. Constant Speed (Uniform Motion):
This is represented by a straight line. The slope of this line remains constant throughout, indicating that the object is covering equal distances in equal time intervals. The steeper the line, the greater the constant speed.
2. Non-Uniform Motion (Variable Speed):
This is represented by a curved line. The slope of the curve is constantly changing, indicating that the object's speed is varying. A steeper part of the curve signifies a higher speed at that point, while a gentler part signifies a lower speed. This type of motion could represent acceleration (increasing speed) or deceleration (decreasing speed).
3. Acceleration and Deceleration:
-
Acceleration: On a distance-time graph, acceleration is represented by a curve that gets progressively steeper. This means the distance covered in each successive time interval is increasing.
-
Deceleration: This is shown by a curve that becomes progressively less steep. The distance covered in each successive time interval is decreasing.
Calculating Speed from the Slope: Examples
Let's illustrate how to calculate speed from the slope of a distance-time graph with a few examples:
Example 1: Constant Speed
Imagine a distance-time graph showing a straight line passing through points (2 seconds, 10 meters) and (6 seconds, 50 meters).
To find the speed, calculate the slope:
Slope = (50 meters - 10 meters) / (6 seconds - 2 seconds) = 40 meters / 4 seconds = 10 m/s
The speed of the object is 10 meters per second.
Example 2: Non-Uniform Motion
Consider a curved line representing non-uniform motion. We can only calculate the average speed over a specific interval. For instance, let’s consider two points on the curve: (1 second, 2 meters) and (3 seconds, 10 meters).
Slope (average speed) = (10 meters - 2 meters) / (3 seconds - 1 second) = 8 meters / 2 seconds = 4 m/s
This only gives the average speed between these two points. The instantaneous speed at any point on the curve would require more advanced calculus techniques.
Beyond the Basics: Advanced Applications
The principles of distance-time graphs extend far beyond simple calculations of speed. They're used in various fields, including:
-
Physics: Understanding motion, acceleration, deceleration, and the relationship between displacement, velocity, and acceleration are crucial concepts studied extensively.
-
Engineering: Designing vehicles, aircraft, and other moving systems requires precise calculations of speed, acceleration, and distance traveled.
-
Sports Science: Analyzing athlete performance involves analyzing distance-time graphs to assess speed, endurance, and efficiency.
-
Traffic Engineering: Studying traffic flow and patterns often involves analyzing distance-time graphs to optimize traffic management and design efficient road systems.
Common Mistakes to Avoid
When interpreting distance-time graphs, several common errors can lead to misinterpretations:
-
Confusing speed and velocity: Remember that speed is a scalar (magnitude only), while velocity is a vector (magnitude and direction). A distance-time graph only shows speed.
-
Incorrectly interpreting curved lines: A curved line doesn't automatically mean acceleration or deceleration. It indicates that the speed is changing, but the specific nature of that change (acceleration or deceleration) requires a closer analysis of the curve's slope.
-
Ignoring the units: Always pay close attention to the units used on the axes of the graph. Incorrect units can lead to incorrect calculations and interpretations.
Conclusion: Mastering Distance-Time Graphs
Understanding the slope of a distance-time graph is not just about calculating speed; it's about unlocking a deeper comprehension of motion and its various complexities. By mastering the interpretation of these graphs – from straight lines representing constant speed to curved lines illustrating variable speed, acceleration, and deceleration – you gain a powerful tool for analyzing and interpreting movement in various real-world scenarios. This knowledge provides a strong foundation for further exploration of more advanced physics concepts and applications across multiple disciplines. From analyzing athletic performance to designing transportation systems, the ability to interpret a distance-time graph is a valuable skill with far-reaching applications.
Latest Posts
Latest Posts
-
How Many Cups In 9 Ounces
Mar 29, 2025
-
How Many Ones Are There Between 1 And 100
Mar 29, 2025
-
025 Expressed As A Percentage Is
Mar 29, 2025
-
What Is The Difference Between A Democracy And Dictatorship
Mar 29, 2025
-
Bill Is To Law As Larva Is To
Mar 29, 2025
Related Post
Thank you for visiting our website which covers about What Does The Slope Of A Distance Time Graph Represent . We hope the information provided has been useful to you. Feel free to contact us if you have any questions or need further assistance. See you next time and don't miss to bookmark.
