The Most Commonly Used Measure Of Central Tendency Is The
News Leon
Apr 06, 2025 · 6 min read
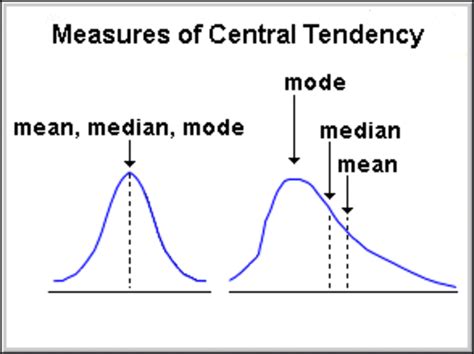
Table of Contents
- The Most Commonly Used Measure Of Central Tendency Is The
- Table of Contents
- The Most Commonly Used Measure of Central Tendency: The Mean, Median, and Mode
- Understanding the Mean
- Calculating the Mean:
- Advantages of Using the Mean:
- Disadvantages and Limitations of the Mean:
- Understanding the Median
- Calculating the Median:
- Advantages of Using the Median:
- Disadvantages and Limitations of the Median:
- Understanding the Mode
- Calculating the Mode:
- Advantages of Using the Mode:
- Disadvantages and Limitations of the Mode:
- Choosing the Right Measure: The Importance of Data Distribution
- Symmetrical Distributions:
- Skewed Distributions:
- Outliers:
- Categorical Data:
- Beyond the Basics: Other Measures of Central Tendency
- Conclusion: Selecting the Best Measure for Your Data
- Latest Posts
- Latest Posts
- Related Post
The Most Commonly Used Measure of Central Tendency: The Mean, Median, and Mode
The heart of descriptive statistics lies in understanding the central tendency of a dataset. This refers to the single value that best represents the entire dataset. While several measures exist, the mean, median, and mode are the most frequently used, each offering unique insights and suitability depending on the data's characteristics. This article will delve deep into each measure, exploring their calculations, applications, limitations, and when one might be preferred over another. We'll also address the importance of understanding the distribution of your data before selecting the most appropriate measure of central tendency.
Understanding the Mean
The mean, often called the average, is arguably the most commonly used measure of central tendency. It's calculated by summing all the values in a dataset and dividing by the total number of values. This simple calculation provides a single number that represents the typical value within the dataset.
Calculating the Mean:
The formula for calculating the arithmetic mean (the most common type of mean) is:
Mean = Σx / n
Where:
- Σx represents the sum of all values in the dataset.
- n represents the total number of values in the dataset.
Example:
Let's say we have the following dataset representing the ages of participants in a study: 25, 30, 35, 40, 45.
The sum of the ages (Σx) is 25 + 30 + 35 + 40 + 45 = 175.
The total number of participants (n) is 5.
Therefore, the mean age is 175 / 5 = 35.
Advantages of Using the Mean:
- Simplicity: The calculation is straightforward and easy to understand.
- Widely Used and Understood: It's a familiar measure, making results easy to communicate.
- Mathematical Properties: The mean possesses desirable mathematical properties, making it useful in further statistical analysis.
Disadvantages and Limitations of the Mean:
- Sensitivity to Outliers: The mean is highly susceptible to outliers (extreme values). A single outlier can significantly skew the mean, making it a poor representation of the central tendency in datasets with extreme values. For instance, if we added an age of 100 to the previous dataset, the mean would jump to 45, a value not truly representative of the majority of ages.
- Not Suitable for Categorical Data: The mean cannot be calculated for categorical data (e.g., colors, types of cars). It only works with numerical data.
- Difficult to Interpret in Skewed Distributions: In skewed distributions (where the data is concentrated more on one side), the mean may not accurately represent the "typical" value.
Understanding the Median
The median is the middle value in a dataset when the values are arranged in ascending order. It's less sensitive to outliers than the mean, making it a more robust measure of central tendency in datasets with extreme values or skewed distributions.
Calculating the Median:
- Arrange the data in ascending order.
- If the number of values (n) is odd, the median is the middle value. For example, in the dataset 10, 15, 20, 25, 30, the median is 20.
- If the number of values (n) is even, the median is the average of the two middle values. For example, in the dataset 10, 15, 20, 25, the median is (15 + 20) / 2 = 17.5.
Advantages of Using the Median:
- Robustness to Outliers: The median is unaffected by extreme values, making it a better choice for datasets with outliers or skewed distributions.
- Suitable for Ordinal Data: The median can be calculated for ordinal data (data that can be ranked, but not necessarily measured numerically).
- Easy Interpretation: The median represents the actual value that separates the upper half of the data from the lower half.
Disadvantages and Limitations of the Median:
- Less Efficient than the Mean: It doesn't use all the data points in its calculation, potentially losing some information.
- Not Suitable for Categorical Data: Like the mean, the median is not applicable to categorical data.
- Less Familiar to Some: While widely used, it might be less familiar to some audiences than the mean.
Understanding the Mode
The mode is the value that appears most frequently in a dataset. A dataset can have one mode (unimodal), two modes (bimodal), or multiple modes (multimodal). If all values occur with the same frequency, the dataset is considered to have no mode.
Calculating the Mode:
Simply count the frequency of each value. The value with the highest frequency is the mode.
Example:
In the dataset: 10, 15, 15, 20, 20, 20, 25, the mode is 20, as it appears three times, more than any other value.
Advantages of Using the Mode:
- Simple to Calculate: The mode is very easy to identify, even for large datasets.
- Applicable to Categorical Data: Unlike the mean and median, the mode can be used for both numerical and categorical data.
- Identifies the Most Common Value: The mode directly indicates the most frequent value in the dataset.
Disadvantages and Limitations of the Mode:
- May Not Be Unique: A dataset can have multiple modes or no mode at all.
- Sensitive to Small Changes in Data: A slight change in data can drastically alter the mode, particularly in datasets with a small number of data points.
- Not Always Representative: In some cases, the mode might not accurately represent the central tendency of the dataset. For instance, in a highly skewed dataset, the mode may be an extreme value.
Choosing the Right Measure: The Importance of Data Distribution
The choice of the most appropriate measure of central tendency depends heavily on the characteristics of your data, particularly its distribution.
Symmetrical Distributions:
In symmetrical distributions (where the data is evenly distributed around the mean), the mean, median, and mode are usually equal or very close. In these cases, the mean is often the preferred choice due to its mathematical properties.
Skewed Distributions:
In skewed distributions, the data is concentrated more on one side.
-
Positively Skewed (right-skewed): The tail extends to the right. The mean is typically greater than the median, and the median is greater than the mode. The median is usually the preferred measure in this case.
-
Negatively Skewed (left-skewed): The tail extends to the left. The mean is typically less than the median, and the median is less than the mode. Again, the median is often the better choice.
Outliers:
The presence of outliers significantly impacts the mean. If outliers are present, the median is a more robust and representative measure of central tendency.
Categorical Data:
For categorical data, the mode is the only appropriate measure of central tendency.
Beyond the Basics: Other Measures of Central Tendency
While the mean, median, and mode are the most commonly used, other measures of central tendency exist, each designed for specific situations. These include:
- Weighted Mean: Assigns different weights to different data points, reflecting their relative importance.
- Geometric Mean: Used for calculating the average of ratios or percentages.
- Harmonic Mean: Used when dealing with rates or ratios, particularly when calculating averages of speeds or rates.
Conclusion: Selecting the Best Measure for Your Data
Selecting the appropriate measure of central tendency is crucial for accurate data representation and interpretation. Understanding the characteristics of your data—its distribution, the presence of outliers, and its type (numerical or categorical)—is key to making the right choice. While the mean is frequently used, the median and mode offer valuable alternatives when the mean is not a suitable representation. Remember, the goal is to choose the measure that best summarizes the "typical" value in your dataset, providing a clear and meaningful representation of your data. By carefully considering these factors, you can ensure the reliability and validity of your statistical analysis.
Latest Posts
Latest Posts
-
Which Of The Following Is Not A Function Of Packaging
Apr 09, 2025
-
Which Is True Regarding Blood Carried In The Veins
Apr 09, 2025
-
What Is The Si Unit Of Current
Apr 09, 2025
-
The Electric Flux Through The Shaded Surface Is
Apr 09, 2025
-
Balanced Equation Of Nacl And Agno3
Apr 09, 2025
Related Post
Thank you for visiting our website which covers about The Most Commonly Used Measure Of Central Tendency Is The . We hope the information provided has been useful to you. Feel free to contact us if you have any questions or need further assistance. See you next time and don't miss to bookmark.