The 50th Percentile Is Equivalent To
News Leon
Mar 14, 2025 · 5 min read
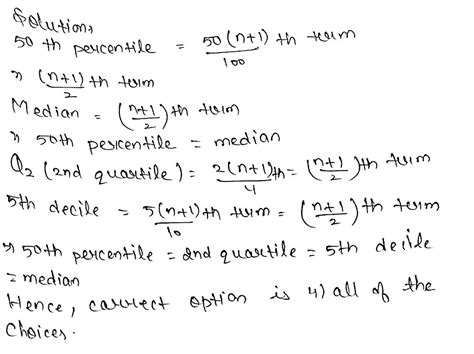
Table of Contents
The 50th Percentile is Equivalent To: A Deep Dive into Median and its Applications
The 50th percentile, a cornerstone of descriptive statistics, holds significant importance in understanding and interpreting data. Frequently referred to as the median, it represents the middle value in a dataset when arranged in ascending order. Understanding its equivalence to the median and its broader applications is crucial for anyone working with data analysis, from students tackling statistical concepts to professionals making data-driven decisions. This comprehensive guide explores the 50th percentile in detail, examining its calculation, interpretation, and practical uses across various fields.
What is a Percentile?
Before delving into the 50th percentile, it's crucial to grasp the broader concept of percentiles. Percentiles divide a dataset into 100 equal parts. The kth percentile is the value below which k percent of the data falls. For instance, the 25th percentile (also known as the first quartile, Q1) indicates the value below which 25% of the data lies. Similarly, the 75th percentile (third quartile, Q3) signifies the value below which 75% of the data lies.
Percentiles provide a robust way to understand the distribution and spread of data, offering a more nuanced picture than simply looking at measures like the mean (average). They're particularly useful when dealing with skewed data, where the mean can be misleadingly influenced by extreme values (outliers).
The 50th Percentile: The Median's Identity
The 50th percentile is the value that separates the lower 50% of the data from the upper 50%. This crucial point is precisely equivalent to the median. The median is a measure of central tendency, providing a more robust representation of the "typical" value in a dataset compared to the mean, especially when dealing with skewed distributions.
Why is the Median Robust to Outliers?
Unlike the mean, which is highly sensitive to extreme values, the median remains relatively unaffected by outliers. This is because the median's calculation only involves identifying the middle value; the magnitude of individual data points beyond the middle doesn't influence its calculation. This makes the median a more reliable indicator of central tendency in datasets containing outliers or extreme values.
Calculating the 50th Percentile (Median)
The method for calculating the median depends on whether the dataset contains an odd or even number of observations:
1. Odd Number of Observations:
When the dataset has an odd number of observations, the median is simply the middle value after sorting the data in ascending order. For example, in the dataset {2, 4, 6, 8, 10}, the median (50th percentile) is 6.
2. Even Number of Observations:
With an even number of observations, the median is the average of the two middle values. Consider the dataset {2, 4, 6, 8}. The two middle values are 4 and 6, so the median (50th percentile) is (4 + 6) / 2 = 5.
Applications of the 50th Percentile (Median)
The 50th percentile, or median, finds widespread applications across numerous fields:
1. Income Distribution and Poverty Analysis:
Economists frequently use the median income to represent the typical income level in a population. This is particularly valuable because the mean income can be skewed upward by a small number of high earners, providing a misleading picture of the average person's income. The median provides a more accurate reflection of the typical income level, crucial for understanding income inequality and poverty rates.
2. Real Estate:
In real estate, the median house price is commonly reported. Similar to income distribution, this metric offers a more robust representation of typical house prices compared to the mean, which can be inflated by a few luxury properties. The median house price provides a more accurate picture of the housing market's affordability for the average buyer.
3. Healthcare:
Median values are often used in healthcare to analyze various metrics, such as hospital stay lengths or patient recovery times. The median provides a more representative measure of these variables, less susceptible to distortion from unusual cases.
4. Environmental Science:
In environmental science, median values are employed to assess pollution levels, water quality, or air quality indices. The median is a valuable tool for summarizing data where outliers may exist due to unusual events or measurement errors.
5. Quality Control:
In manufacturing and quality control, the median can be used to monitor process parameters and identify potential issues. Its robustness to outliers makes it a suitable measure for detecting deviations from expected values without being unduly influenced by extreme data points.
Distinguishing the Median from the Mean and Mode
Understanding the differences between the median, mean, and mode is critical for appropriate data interpretation.
- Mean: The average value, calculated by summing all values and dividing by the number of observations. Highly susceptible to outliers.
- Median: The middle value when data is ordered. Robust to outliers.
- Mode: The most frequently occurring value. Not always applicable, particularly with continuous data.
The choice between these measures depends on the data's distribution and the goal of the analysis. For skewed data or data with outliers, the median is generally preferred.
The 50th Percentile in Statistical Software and Programming
Most statistical software packages and programming languages offer functions to calculate percentiles, including the 50th percentile (median). For example, in Python's numpy library, you can use the percentile function, while R offers the quantile function for calculating percentiles.
Beyond the Basics: Understanding Percentile Ranks and their Applications
While the 50th percentile represents the median value, the concept of percentile ranks provides additional context. The percentile rank of a data point indicates the percentage of data values that fall below that specific point. For example, a data point with a percentile rank of 70 means that 70% of the data falls below it.
Conclusion: The 50th Percentile – A Powerful Tool for Data Analysis
The 50th percentile, or median, is a fundamental concept in statistics with far-reaching applications. Its robustness to outliers and its clear interpretation make it a valuable tool for understanding data distribution and making informed decisions across a wide variety of fields. By understanding its equivalence to the median and its practical implications, you can significantly improve your ability to analyze and interpret data effectively. From understanding income inequality to assessing environmental conditions, the 50th percentile serves as a robust and reliable measure of central tendency, offering a clearer and more nuanced picture of data than the mean in many instances. Mastering this concept is an essential step towards developing strong data literacy skills.
Latest Posts
Related Post
Thank you for visiting our website which covers about The 50th Percentile Is Equivalent To . We hope the information provided has been useful to you. Feel free to contact us if you have any questions or need further assistance. See you next time and don't miss to bookmark.