Marginal Product And Average Product Graph
News Leon
Mar 29, 2025 · 6 min read
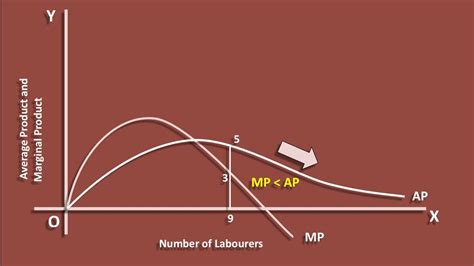
Table of Contents
Marginal Product and Average Product: A Comprehensive Graphical Analysis
Understanding the relationship between marginal product and average product is crucial for businesses aiming to optimize production and maximize profits. This article provides a comprehensive graphical analysis of these concepts, exploring their individual characteristics, their interconnectedness, and the insights they offer for managerial decision-making. We'll delve into the underlying economics, illustrate key relationships with detailed graphs, and discuss real-world applications.
What is Marginal Product?
The marginal product (MP) of an input, such as labor, is the additional output produced when one more unit of that input is employed, holding all other inputs constant. Think of it as the change in total output resulting from a one-unit increase in a specific input. Mathematically, it's expressed as:
MP = ΔTotal Output / ΔInput (e.g., ΔLabor)
For example, if adding one more worker increases production from 10 units to 15 units, the marginal product of that worker is 5 units. It's important to note that the marginal product is not constant; it varies depending on the level of input already employed.
The Law of Diminishing Marginal Returns
A fundamental principle in economics is the law of diminishing marginal returns. This law states that as more and more units of a variable input (like labor) are added to fixed inputs (like capital), the marginal product of the variable input will eventually decline. This doesn't mean the total output decreases; it simply means the rate at which output increases diminishes.
Imagine a bakery with a fixed number of ovens. Adding one baker might significantly increase the number of loaves produced. Adding a second baker will also increase production, but perhaps not as much as the first. As you continue to add bakers, eventually the added output from each additional baker will decrease, perhaps even to the point where they're getting in each other's way.
This law is graphically represented by a marginal product curve that initially rises, reaches a peak, and then slopes downward.
What is Average Product?
The average product (AP), also known as the average physical product, measures the average output per unit of input. It's calculated by dividing the total output by the quantity of the input used. Mathematically:
AP = Total Output / Input (e.g., Total Output / Labor)
Using our bakery example, if 10 bakers produce 100 loaves, the average product of labor is 10 loaves per baker. Like marginal product, the average product is not a fixed value; it changes as the level of input changes.
The Relationship Between Marginal Product and Average Product: A Graphical Representation
The relationship between MP and AP is intrinsically linked and can be effectively illustrated using a graph. We'll typically plot the quantity of the variable input (e.g., labor) on the horizontal axis and both MP and AP on the vertical axis.
(Insert a graph here showing both MP and AP curves. The MP curve should be bell-shaped, initially rising and then falling. The AP curve should be U-shaped, rising to intersect the MP curve at its maximum point, then falling. Label clearly the axes, curves, and the point of intersection.)
Key features of the graph:
-
MP curve intersects AP curve at the maximum point of AP: This is a crucial relationship. When MP is above AP, AP is rising. When MP is below AP, AP is falling. The point where they intersect represents the highest average productivity.
-
MP curve is always above AP curve when AP is rising: This makes intuitive sense. If the additional output from one more unit of input (MP) is greater than the average output per unit (AP), then the average must be pulled upwards.
-
MP curve is always below AP curve when AP is falling: Conversely, if the additional output (MP) is less than the average output (AP), then the average will be pulled downwards.
-
MP reaches zero before AP reaches zero: While AP eventually falls to zero (meaning zero output per unit of input), MP will hit zero first. This reflects the point where adding more input doesn't increase output at all.
-
Stages of Production: The graph typically demonstrates three stages of production based on the relationship between MP and AP. Stage I represents increasing average productivity, Stage II is characterized by diminishing but still positive MP and AP, and Stage III shows negative MP. Rational firms generally operate in Stage II, where the law of diminishing returns is in effect but total output is still increasing.
Economic Implications and Managerial Decisions
Understanding the MP and AP curves provides valuable insights for businesses making crucial decisions:
-
Optimal Input Level: The point where the MP curve intersects the AP curve indicates the optimal level of input for maximizing average productivity. Businesses should aim to operate near this point to ensure efficient resource utilization.
-
Profit Maximization: While maximizing average productivity is important, profit maximization often requires considering the cost of inputs. The interplay of marginal product and input costs (e.g., wages) determines the profit-maximizing level of input. Firms typically hire labor until the marginal revenue product (MRP) – the additional revenue generated by one more unit of labor – equals the marginal cost (MC) of labor. Since MRP is directly linked to MP (MRP = MP * Price of Output), understanding MP is essential for profit optimization.
-
Production Planning: The curves help businesses anticipate the effects of changes in input levels on total output and average productivity. This is crucial for production planning and adjusting resource allocation based on anticipated demand.
-
Technological Change: Technological advancements can shift both MP and AP curves. For example, new machinery might dramatically increase both marginal and average productivity, leading to a higher output level with the same amount of input. Analyzing the impact of technological change on these curves is fundamental for strategic planning.
-
Economies of Scale: While the law of diminishing returns focuses on the relationship between variable inputs and fixed inputs in the short run, the concept of economies of scale describes the long-run relationship between firm size and average cost. Understanding MP and AP provides insights into determining the optimal size of a business and achieving economies of scale.
Beyond Labor: Applying the Concepts to Other Inputs
While our examples have primarily focused on labor, the concepts of MP and AP apply to all inputs in the production process, including capital, land, and raw materials. Analyzing the marginal and average product of these inputs offers a comprehensive understanding of how changes in any input affect the overall productivity and profitability of a business.
Conclusion: A Powerful Tool for Business Analysis
The graphical representation of marginal product and average product provides a powerful tool for understanding the relationship between input levels and output. By analyzing these curves, businesses can make informed decisions regarding resource allocation, production planning, and profit maximization. Understanding the law of diminishing marginal returns and the interplay between MP and AP is essential for effective management and achieving sustained business success. This analysis moves beyond simple calculations and offers a dynamic understanding of productivity, efficiency, and the challenges of scaling production within a resource-constrained environment. It enables businesses to optimize not only their use of labor but also all other vital inputs for maximum economic benefit.
Latest Posts
Latest Posts
-
How Do The Daughter Cells Compare To The Parent Cell
Apr 01, 2025
-
A Group Of Closely Related Species Is A
Apr 01, 2025
-
Which Of The Is Not A Greenhouse Gas
Apr 01, 2025
-
How Many Moles In One Liter Of Water
Apr 01, 2025
-
Why Are Human Sex Hormones Considered Lipids
Apr 01, 2025
Related Post
Thank you for visiting our website which covers about Marginal Product And Average Product Graph . We hope the information provided has been useful to you. Feel free to contact us if you have any questions or need further assistance. See you next time and don't miss to bookmark.
