How To Find Variance In Probability Distribution
News Leon
Mar 26, 2025 · 5 min read
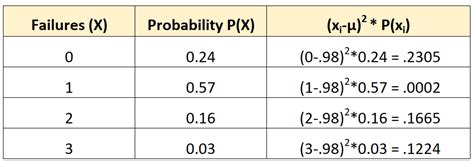
Table of Contents
How to Find Variance in Probability Distribution
Understanding variance is crucial in probability and statistics. It measures how spread out a data set is, indicating the dispersion of individual data points from the mean. A high variance signifies a wide spread, while a low variance indicates data points clustered closely around the mean. This article delves into the methods for calculating variance in various probability distributions, providing a comprehensive guide for both beginners and those seeking a refresher.
Understanding Variance and its Significance
Before diving into the calculations, let's solidify the foundational concept. Variance (σ²) is the average of the squared differences from the mean (μ). This means we calculate how far each data point deviates from the average, square these deviations to eliminate negative values, and then average the squared deviations. The square root of the variance is the standard deviation (σ), providing a measure of dispersion in the original units of the data.
Why is variance important?
- Risk Assessment: In finance, variance is a key indicator of investment risk. A higher variance signifies greater volatility and uncertainty.
- Quality Control: In manufacturing, variance helps assess the consistency of a production process. Lower variance indicates higher quality control.
- Predictive Modeling: In machine learning, variance is a vital component in evaluating model performance and accuracy. High variance suggests overfitting, while low variance might indicate underfitting.
- Data Analysis: Understanding variance allows for a more complete understanding of data distribution and behavior. It's a fundamental building block for more advanced statistical analysis.
Calculating Variance for Different Probability Distributions
The method for calculating variance differs depending on the type of probability distribution. We'll examine some common distributions:
1. Discrete Probability Distributions
For discrete distributions, where the random variable can only take on specific values, we calculate variance using the following formula:
σ² = Σ[(xᵢ - μ)² * P(xᵢ)]
Where:
- σ² represents the variance.
- xᵢ represents each individual value of the random variable.
- μ represents the mean (expected value) of the distribution, calculated as μ = Σ[xᵢ * P(xᵢ)].
- P(xᵢ) represents the probability of the random variable taking on the value xᵢ.
- Σ denotes the summation over all possible values of xᵢ.
Example: Calculating Variance of a Discrete Distribution
Let's consider a simple example: A fair six-sided die. The probability distribution is:
| xᵢ | 1 | 2 | 3 | 4 | 5 | 6 |
|---|---|---|---|---|---|---|
| P(xᵢ) | 1/6 | 1/6 | 1/6 | 1/6 | 1/6 | 1/6 |
-
Calculate the mean (μ): μ = (11/6) + (21/6) + (31/6) + (41/6) + (51/6) + (61/6) = 3.5
-
Calculate the variance (σ²):
σ² = [(1-3.5)² * (1/6)] + [(2-3.5)² * (1/6)] + [(3-3.5)² * (1/6)] + [(4-3.5)² * (1/6)] + [(5-3.5)² * (1/6)] + [(6-3.5)² * (1/6)] σ² = 2.9167
Therefore, the variance of the fair six-sided die is approximately 2.9167.
2. Continuous Probability Distributions
For continuous distributions, where the random variable can take on any value within a given range, the calculation involves integration:
σ² = ∫[(x - μ)² * f(x)] dx
Where:
- σ² represents the variance.
- x represents the random variable.
- μ represents the mean (expected value) of the distribution, calculated as μ = ∫[x * f(x)] dx.
- f(x) represents the probability density function (PDF) of the distribution.
- ∫ denotes integration over the entire range of x.
This integration can be complex and often requires specialized mathematical techniques or software.
3. Specific Continuous Distributions: Shortcut Formulas
Fortunately, many common continuous distributions have established formulas for variance:
-
Normal Distribution: The variance of a normal distribution with mean μ and standard deviation σ is simply σ².
-
Exponential Distribution: The variance of an exponential distribution with rate parameter λ is 1/λ².
-
Uniform Distribution: The variance of a uniform distribution over the interval [a, b] is (b-a)²/12.
These pre-derived formulas significantly simplify the calculation process.
Understanding the Relationship Between Variance and Standard Deviation
As previously mentioned, the standard deviation (σ) is the square root of the variance (σ²):
σ = √σ²
The standard deviation provides a more interpretable measure of dispersion because it's in the same units as the original data. While variance provides a crucial measure of spread, the standard deviation offers a more intuitive understanding of how much data points deviate from the mean.
Applications and Advanced Concepts
The applications of variance extend far beyond the basics:
-
Hypothesis Testing: Variance plays a crucial role in statistical hypothesis testing, allowing us to make inferences about population parameters based on sample data. Tests like the F-test directly compare variances.
-
Analysis of Variance (ANOVA): ANOVA is a powerful statistical technique used to compare the means of multiple groups. It relies heavily on the concept of variance and its decomposition.
-
Regression Analysis: In regression analysis, variance is used to assess the goodness of fit of a model. The explained variance (R²) measures the proportion of the variance in the dependent variable explained by the independent variables.
-
Time Series Analysis: Variance plays a critical role in analyzing the volatility and predictability of time series data.
Practical Tips for Calculating Variance
-
Use statistical software: Software packages like R, Python (with libraries like NumPy and Pandas), and SPSS significantly simplify variance calculations, especially for large datasets or complex distributions.
-
Organize your data: Clearly organizing your data before calculating variance helps prevent errors. Use spreadsheets or databases to manage your data effectively.
-
Double-check your calculations: Manually calculating variance can be prone to errors. Verify your results by using different methods or software.
-
Understand the context: Always consider the context of your data when interpreting variance. A high variance might be expected in some situations, while it could indicate a problem in others.
Conclusion
Calculating variance is a fundamental skill in probability and statistics. Understanding how to calculate variance for different probability distributions is crucial for a wide range of applications, from risk assessment in finance to model evaluation in machine learning. By mastering this concept, you'll gain a deeper understanding of data dispersion, enabling you to draw more informed conclusions from your analysis. Remember to utilize the appropriate formulas and tools for your specific needs, ensuring accuracy and efficiency in your calculations. Furthermore, always consider the context of your data and its implications when interpreting the variance and standard deviation values.
Latest Posts
Related Post
Thank you for visiting our website which covers about How To Find Variance In Probability Distribution . We hope the information provided has been useful to you. Feel free to contact us if you have any questions or need further assistance. See you next time and don't miss to bookmark.