Energy Level Diagram Of Hydrogen Atom
News Leon
Mar 22, 2025 · 5 min read
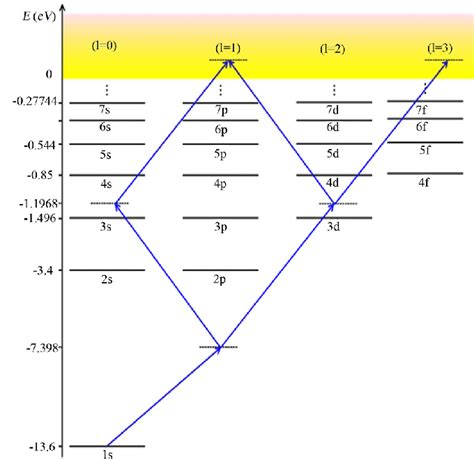
Table of Contents
Energy Level Diagram of the Hydrogen Atom: A Comprehensive Guide
The hydrogen atom, the simplest atom in the universe, serves as a foundational cornerstone in understanding atomic structure and quantum mechanics. Its energy level diagram, a visual representation of the allowed energy states of the electron, is crucial for comprehending atomic spectra, chemical bonding, and numerous other quantum phenomena. This comprehensive guide will delve into the intricacies of the hydrogen atom's energy level diagram, exploring its derivation, interpretation, and significance.
Understanding the Basics: Quantized Energy Levels
Unlike classical physics, where an electron could theoretically occupy any energy level, quantum mechanics dictates that electrons in atoms exist only in specific, discrete energy levels. This quantization of energy is a fundamental principle governing atomic behavior. The energy levels of the hydrogen atom are described by the principal quantum number, n, which can take on positive integer values (n = 1, 2, 3,...). The lowest energy level, corresponding to n = 1, is called the ground state. Higher energy levels (n > 1) are called excited states.
The Bohr Model: A Simplified Picture
While a more accurate description requires the full machinery of quantum mechanics, the Bohr model provides a useful, albeit simplified, visualization of the hydrogen atom's energy levels. The Bohr model postulates that the electron orbits the nucleus in specific circular orbits, each corresponding to a particular energy level. The energy of each level is given by:
E<sub>n</sub> = -R<sub>H</sub>/n²
where:
- E<sub>n</sub> is the energy of the electron in the nth energy level.
- R<sub>H</sub> is the Rydberg constant for hydrogen (approximately 13.6 eV).
- n is the principal quantum number.
This equation reveals that the energy levels become closer together as n increases, ultimately converging to zero energy as n approaches infinity (ionization).
The Energy Level Diagram: A Visual Representation
The energy level diagram for hydrogen is typically represented as a vertical energy scale, with the energy levels depicted as horizontal lines. The ground state (n=1) is located at the lowest energy level, and subsequent excited states (n=2, 3, 4...) are positioned at progressively higher energy levels. The spacing between energy levels decreases as n increases, reflecting the formula mentioned above.
Interpreting the Diagram
The diagram provides several crucial pieces of information:
-
Energy Differences: The vertical distance between any two energy levels represents the energy difference (ΔE) between those levels. This energy difference is crucial in understanding atomic transitions.
-
Transitions and Spectral Lines: When an electron transitions from a higher energy level to a lower energy level, it emits a photon whose energy is equal to the energy difference between the levels (ΔE = hν, where h is Planck's constant and ν is the frequency of the emitted photon). This emitted photon corresponds to a specific spectral line in the hydrogen atom's emission spectrum. Conversely, when a photon of appropriate energy is absorbed, an electron can transition to a higher energy level.
-
Ionization Energy: The energy required to completely remove the electron from the atom (transition from n = 1 to n = ∞) is the ionization energy, which for hydrogen is 13.6 eV. This corresponds to the energy required to overcome the attractive force between the proton and the electron.
Beyond the Bohr Model: Quantum Mechanical Refinements
While the Bohr model provides a useful qualitative understanding, a more accurate description requires the full quantum mechanical treatment. The Schrödinger equation, a fundamental equation in quantum mechanics, can be solved for the hydrogen atom, yielding more precise energy levels and wave functions (which describe the probability of finding the electron at a given location).
Fine Structure and Spin-Orbit Coupling
The quantum mechanical solution reveals a finer structure within the energy levels. This "fine structure" arises from relativistic effects and spin-orbit coupling – the interaction between the electron's spin and its orbital angular momentum. This results in a splitting of energy levels, especially noticeable at higher values of n.
Lamb Shift
Even more subtle energy level shifts, known as the Lamb shift, arise from quantum electrodynamic (QED) effects. These effects, arising from the interaction of the electron with the vacuum fluctuations of the electromagnetic field, lead to incredibly small but measurable differences in the energy levels.
Applications of the Hydrogen Atom Energy Level Diagram
The hydrogen atom's energy level diagram is not merely an academic exercise; it has far-reaching applications in various fields:
Spectroscopy: Analyzing Atomic Spectra
The diagram is essential for interpreting atomic spectra, which are patterns of light emitted or absorbed by atoms. By analyzing the wavelengths of spectral lines, scientists can determine the energy levels involved in the transitions and identify the element responsible for the spectrum. This technique is widely used in astronomy, chemistry, and materials science.
Astrophysics: Understanding Stellar Spectra
The hydrogen atom's spectral lines are prominently visible in the spectra of stars, allowing astronomers to analyze the composition and temperature of stars. The analysis of spectral line shifts due to the Doppler effect allows for the determination of stellar radial velocities.
Laser Technology: Stimulated Emission
The understanding of atomic energy levels is fundamental to the operation of lasers. Lasers rely on stimulated emission, where an electron transitions from a higher energy level to a lower energy level, emitting a photon that stimulates other electrons to undergo the same transition, resulting in a coherent beam of light.
Quantum Computing: Qubits
The energy levels of atoms, including the hydrogen atom, are being explored as potential qubits (quantum bits) for quantum computing. The precise control of atomic energy levels is crucial for manipulating and storing quantum information.
Conclusion: A Foundation for Quantum Understanding
The energy level diagram of the hydrogen atom serves as a fundamental building block for understanding atomic structure, quantum mechanics, and numerous applications across various scientific disciplines. While the Bohr model offers a simplified picture, the quantum mechanical treatment provides a more accurate and comprehensive description of the atom's behavior. The diagram's implications extend far beyond simple atomic physics, impacting our understanding of stars, lasers, and even the future of quantum computing. Further study of this diagram unlocks deeper insights into the fascinating world of quantum mechanics and its widespread impact on our technological advancements.
Latest Posts
Latest Posts
-
A Group Of Tissues Working Together
Mar 22, 2025
-
Which Of The Following Is An Example Of Adaptation
Mar 22, 2025
-
The Unit Kilowatt Hour Is A Unit Of
Mar 22, 2025
-
Which Of The Following Statements Regarding Hemophilia Is Correct
Mar 22, 2025
-
Complete The Sentence With The Correct Form Of The Word
Mar 22, 2025
Related Post
Thank you for visiting our website which covers about Energy Level Diagram Of Hydrogen Atom . We hope the information provided has been useful to you. Feel free to contact us if you have any questions or need further assistance. See you next time and don't miss to bookmark.
