Construct A Frequency Distribution For The Data Using Five Classes
News Leon
Apr 07, 2025 · 6 min read
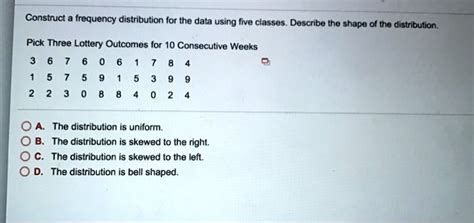
Table of Contents
Constructing a Frequency Distribution: A Comprehensive Guide with Five Classes
Creating a frequency distribution is a fundamental step in data analysis. It helps to organize and summarize data, making it easier to identify patterns, trends, and outliers. This comprehensive guide will walk you through the process of constructing a frequency distribution using five classes, explaining the concepts and providing practical examples. We'll delve into the importance of frequency distributions, the steps involved in their creation, and how to interpret the resulting data. We'll also touch upon different types of frequency distributions and explore advanced applications.
Understanding Frequency Distributions
A frequency distribution is a table that displays the frequency of various outcomes in a dataset. It organizes data into classes or intervals, showing how many data points fall within each interval. This summarization makes large datasets more manageable and understandable. The process involves several key steps, which we'll explore in detail.
Why Use Frequency Distributions?
Frequency distributions offer several key advantages:
- Data Summarization: They condense large datasets into a more manageable and easily interpretable format.
- Pattern Identification: They help to reveal patterns, trends, and central tendencies within the data.
- Outlier Detection: They allow for the identification of unusual or extreme values (outliers) that may warrant further investigation.
- Data Visualization: They form the basis for various data visualizations, such as histograms and frequency polygons, which provide a visual representation of the data's distribution.
- Statistical Analysis: They are essential for performing various statistical analyses, such as calculating measures of central tendency (mean, median, mode) and dispersion (range, variance, standard deviation).
Steps to Construct a Frequency Distribution with Five Classes
Let's assume we have a dataset of exam scores for a class of 30 students:
78, 85, 92, 68, 75, 88, 95, 72, 80, 82, 90, 70, 76, 84, 89, 98, 65, 79, 86, 91, 73, 81, 87, 93, 77, 83, 94, 69, 74, 96
Here's how to construct a frequency distribution with five classes:
1. Determine the Range:
The range is the difference between the highest and lowest values in the dataset.
- Highest value: 98
- Lowest value: 65
- Range: 98 - 65 = 33
2. Determine the Class Width:
The class width is the range divided by the number of classes (in this case, five). It's crucial to round this number up to the nearest whole number to ensure all data points are included.
- Class width: 33 / 5 = 6.6 Rounded up to 7.
3. Determine the Class Limits:
Now, we define the lower and upper limits for each of the five classes. We start with the lowest value (65) as the lower limit of the first class and add the class width (7) successively to determine the upper limit of each class. This ensures that each class has the same width.
- Class 1: 65 - 71
- Class 2: 72 - 78
- Class 3: 79 - 85
- Class 4: 86 - 92
- Class 5: 93 - 99
4. Tally the Data:
Go through the original dataset and count how many data points fall within each class. This step is often made easier by creating a tally mark for each data point within its respective class.
- Class 1 (65-71): |||| (4)
- Class 2 (72-78): |||||| (6)
- Class 3 (79-85): ||||||| (7)
- Class 4 (86-92): |||||||| (8)
- Class 5 (93-99): ||||| (5)
5. Create the Frequency Distribution Table:
Finally, organize the data into a frequency distribution table, including the class limits, tally marks, and frequencies:
| Class Limits | Tally Marks | Frequency (f) |
|---|---|---|
| 65 - 71 | ||
| 72 - 78 | ||
| 79 - 85 | ||
| 86 - 92 | ||
| 93 - 99 | ||
| Total | 30 |
This table summarizes the distribution of exam scores. We can clearly see that the majority of scores fall within the 79-92 range.
Types of Frequency Distributions
Several types of frequency distributions exist, each offering unique insights into the data:
- Ungrouped Frequency Distribution: This is used for datasets with a small number of distinct values. Each value is listed separately with its corresponding frequency.
- Grouped Frequency Distribution: This is used for datasets with a larger number of values. The data is grouped into classes or intervals. This is the type we constructed above.
- Relative Frequency Distribution: This shows the proportion or percentage of data points that fall within each class. It is calculated by dividing the frequency of each class by the total number of data points.
- Cumulative Frequency Distribution: This shows the cumulative number of data points up to a given class. It's calculated by adding the frequencies of all preceding classes to the frequency of the current class.
Interpreting the Frequency Distribution
The frequency distribution table provides valuable information about the data:
- Central Tendency: We can visually estimate the center or most frequent scores.
- Spread: The distribution's spread indicates the variability of the scores. A wider spread suggests greater variability.
- Shape: The distribution's shape can be symmetrical (bell-shaped) or skewed (leaning towards one side). Skewness indicates that one tail of the distribution is longer than the other.
Further statistical analysis can be performed on the frequency distribution to gain more detailed insights. For example, calculating the mean, median, and mode can provide a deeper understanding of the central tendency.
Advanced Applications and Considerations
Frequency distributions are a cornerstone of many statistical techniques. They are used in:
- Hypothesis Testing: Comparing distributions to determine if there's a significant difference between groups.
- Regression Analysis: Understanding the relationship between variables.
- Quality Control: Monitoring processes and detecting deviations from expected values.
- Predictive Modeling: Building models to predict future outcomes based on historical data.
Choosing the Number of Classes: There's no single "correct" number of classes. The ideal number depends on the dataset size and the desired level of detail. Too few classes may obscure important details, while too many classes may lead to a cumbersome and less informative summary. A common rule of thumb is to use Sturges' rule, which suggests approximately k = 1 + 3.322 * log10(n) classes, where 'n' is the number of data points.
Class Boundaries: To avoid ambiguity, especially when dealing with continuous data, it's beneficial to define class boundaries. Class boundaries are values that separate adjacent classes and ensure no data point falls between classes.
Open-Ended Classes: Sometimes, the lowest or highest class might be open-ended, meaning it has no lower or upper limit. This is useful when dealing with extreme values or unknown limits.
Conclusion
Constructing a frequency distribution is a crucial step in any data analysis process. By organizing and summarizing data, it reveals patterns, trends, and outliers, allowing for more effective interpretation and subsequent analysis. Understanding the steps involved, the different types of frequency distributions, and how to interpret the results is essential for anyone working with data. This guide has provided a comprehensive overview, empowering you to effectively summarize and analyze your datasets using frequency distributions. Remember to choose the number of classes appropriate for your data and consider using class boundaries for improved clarity. By mastering this technique, you'll significantly enhance your ability to extract meaningful insights from your data.
Latest Posts
Latest Posts
-
The Position Of A Particle Moving Along The X Axis
Apr 07, 2025
-
Are Peroxisomes Part Of The Endomembrane System
Apr 07, 2025
-
How Do Political Parties Differ From Interest Groups
Apr 07, 2025
-
Animal That Has A Segmented Body
Apr 07, 2025
-
A Deficiency Statement Is Based On Which Element
Apr 07, 2025
Related Post
Thank you for visiting our website which covers about Construct A Frequency Distribution For The Data Using Five Classes . We hope the information provided has been useful to you. Feel free to contact us if you have any questions or need further assistance. See you next time and don't miss to bookmark.